The Market Profile value areas and ShadowTrader Pivots for /ESM19 and /NQM19 Futures are posted free every morning
in the ShadowTrader Swing Trader newsletter.
Up ten in S&P futures this morning but not showing a true gapThere is a lot of discussion as to what constitutes a gap. Is it measured to the prior day's close, or to the prior day's high or low? Here at ShadowTrader, we believe that it is always and only to a prior day's high or low, thus creating a true gap or space on the chart between one day and the next. Thus a true gap is one that has price opening completely outside of the prior day's range (either above the high or below the low) and anything else is just a gap that has far less import. As a gap is a "reordering of thinking", only a true gap really changes the tone and creates opportunity to trade earlier (near the open) rather than later. More on the market profileA way of reading the market that recognizes either time spent or volume traded at a particular price level. A market profile can be either made up of “TPO’s” (time price opportunities), or volume. TPO’s measure how much time was spent at a particular price, while volume-based market profiles measure how much volume traded at a particular price. Generally, market profile is used in the trading of futures, especially the /ES. ShadowTrader utilizes volume based profiles. as of yet as we are currently trading just inside of the RTHRegular Trading Hours. In the /ES this means the price action from 9:30am EST to 4:15pm EST only. range. There’s a lot of signposts above us so let’s look at all of them so that we can be well prepared for whatever is in store today….
WindoTrader 702-800-4628 Speak with Terry about the ShadowTrader discount
| 2793.00 | ONHOvernight High. A term mostly used in describing the futures market which has an overnight session and trades almost around the clock. To be precise, in the /ES this is the high made between 4:30pm EST and 9:30am EST the next day./RTH/Bottom of Gap |
|---|---|
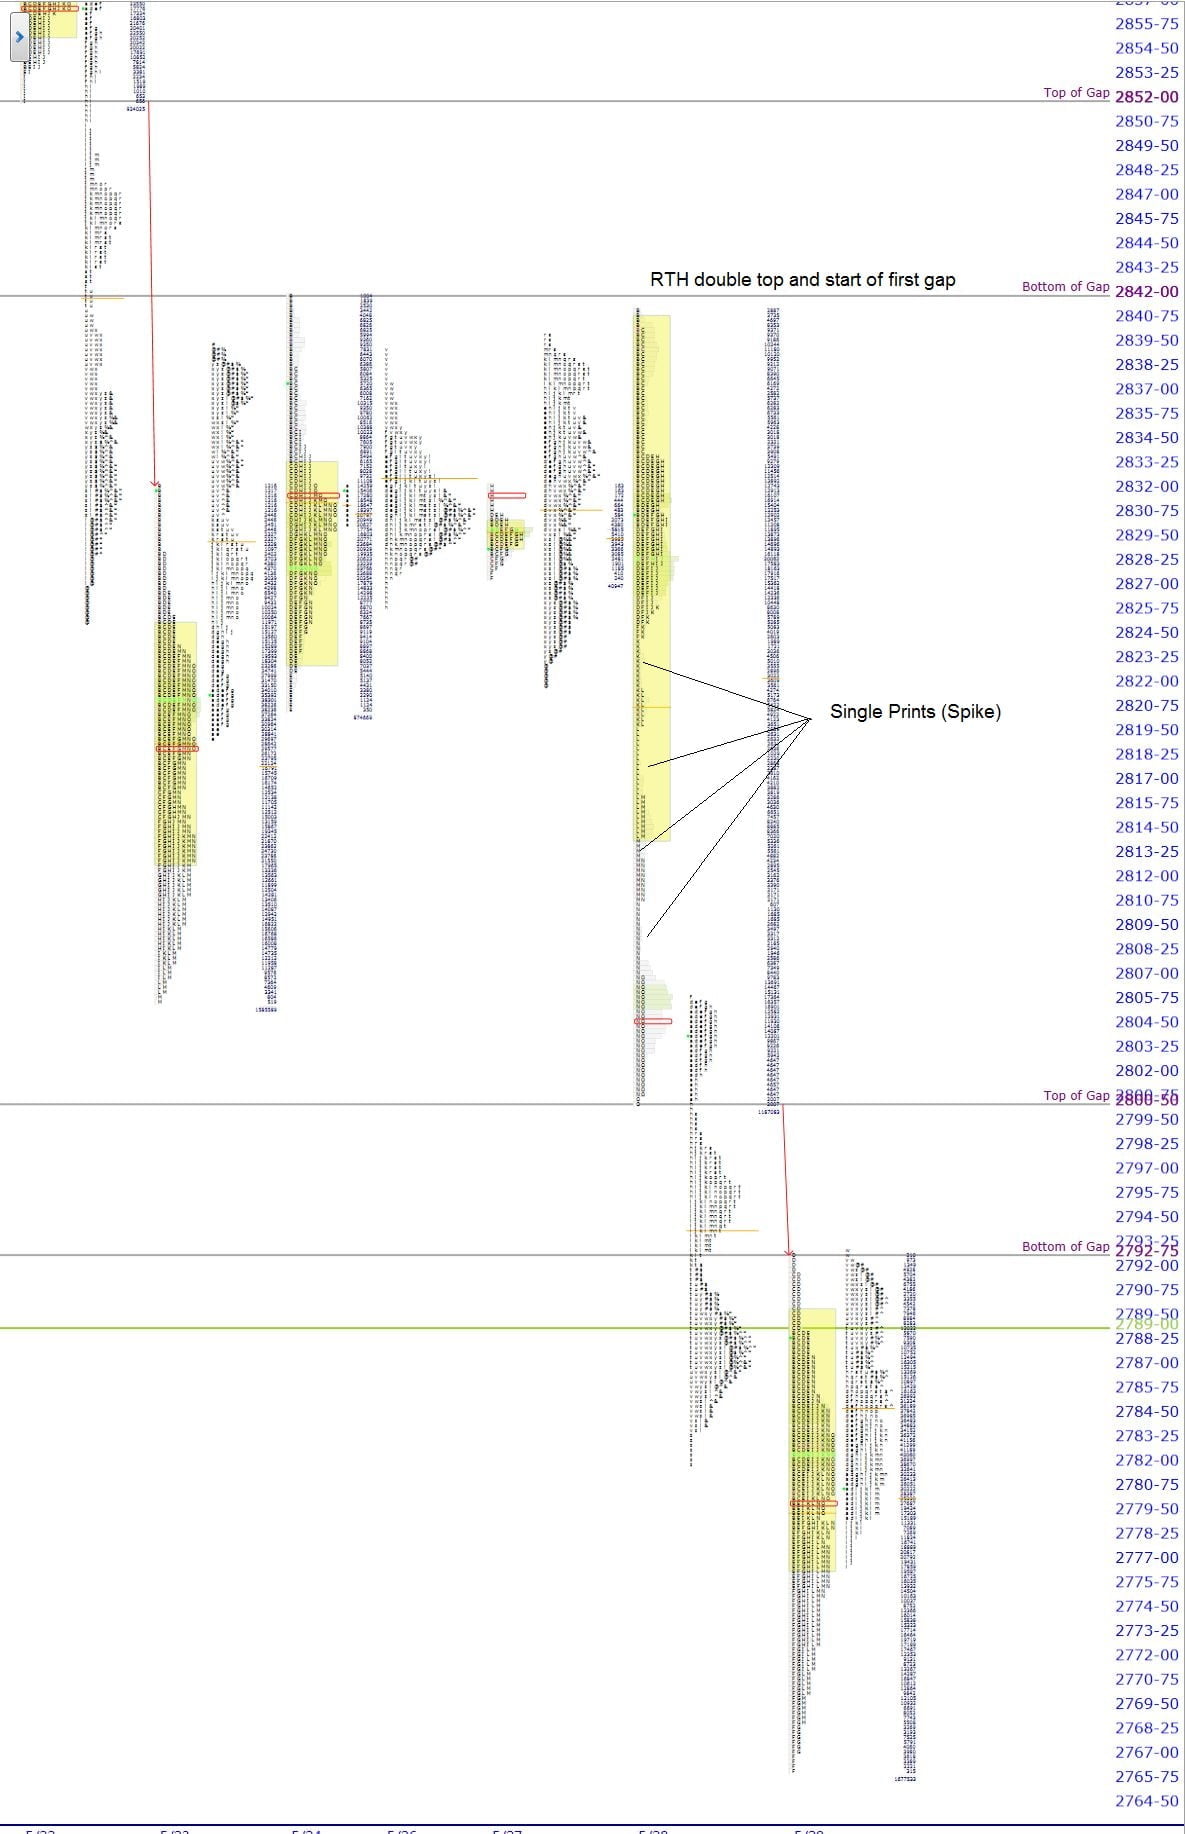
| 2800.50 | Top of Gap/Start of SpikeA set of single prints that are created in the last 30 minute session of the day which form at the top or bottom of a range. |
| 2779.50 | halfbackA term for the halfway point between the high and low of any session, could be a day session or an overnight session. On Peter's market profile charts it is always a dark yellow horizontal line at that level./settlement |
The ongoing narrative that you update before the bell rings is always the most important thing. It has been proven that human beings will place far too more emphasis on more recent events than on those that are further in the past. This dynamic is especially prevalent in trading and is often our downfall. To that end, I believe this is a good morning to look past yesterday’s action and focus on the days prior because there are a number of significant elements in the recent distributions.
We now have two unfilled gaps above us. These are important and should be thought of as if there were many VPOC’s above us stacking. Markets don’t like gaps and most gaps eventually fill. Carry them forward.
The poor structure of 5/28 is also to be carried forward as it culminated in a spikeA set of single prints that are created in the last 30 minute session of the day which form at the top or bottom of a range.. As of now (according to spike rulesA framework for analyzing a spike on the next trading day after it is formed.
Because the spike forms late in the day, it is impossible to gauge whether or not the higher or lower prices that have run quickly away from value will be deemed fair later. Thus we employ the spike rules in the next session.
Everything below is assuming a spike at the TOP of a daily range (reverse for a spike at the BOTTOM of a range)
-If prices open above the spike, that is considered bullish and tells us that prices didn't auction high enough in the spike to attract sellers and cut off buying activity. Monitor to see if there is acceptance above the spike.
-Prices opening within the spike confirm the higher prices of the spike. This tells us that the prices are fair enough for two sided...), the lower prices of the spikeA set of single prints that are created in the last 30 minute session of the day which form at the top or bottom of a range. have not only been accepted but never tested at all. While this is definitely bearish, I like to take the other side of things so that I’m not surprised when prices rip the other way. The other side of the argument is simply that this structure needs to be repaired and more importantly that those traders sold away from valueThis value has nothing to do with valuation. It denotes prices that are "fair". Fair in this sense means a price that is common to a lot of participants. An item that you buy once per week in a store at a price that doesn't fluctuate has a "fair price". You can express this by a formula Value = Price + Time or Value = Price + Volume Either of the above are valid ways of expressing value. In the first equation, value is defined by price staying the same for a long period of time. In the futures market, this would be an area that is revisted a lot during a particular session or multiple sessions. The point of control is the price level where the most amount of time was spent during an RTH session. James Dalton refers to this level as "the fairest price to do business". Using vo... More, then followed up with 100% net shortThe concept of being more short than long in an options spread by creating options spreads where you are selling more structures than you are buying or selling wider structures than the ones you are buying. Example would be a broken wing butterfly. This spread is made up of two structures, one long vertical and one short vertical. In the BWB, the short vertical is wider than the long vertical. When you are long this spread, you are said to be in an options position that is "net short"
overnight inventoryA way of measuring overnight activity in the futures market by just noting how much of the overnight activity happens to fall above the prior day's settlement value (4:15pm EST close) and how much falls below. If more activity is above the settlement, then overnight inventory is said to be net long. If more is below, then it is said to be net short. If all of the overnight activity is above the settlement, then it is said to be 100% net long. If all of the activity is below the settlement then it is said to be 100% net short. The overnight inventory situation matters most and has the most impact on early trade when it is skewed 100% in either direction because when the imbalance is very large like that then the odds of an early correction increase greatly. This is due to the fact that most..., and promptly left another downside gap on top of that. So if you think in those terms, you can see that the potential for a rally is there. Remember that prices rise simply because there are more buyers than sellers. There is a lot of “old business” (shorts that need to cover) above us.
If none of the nuances above come into play today, then that’s a more bearish sign and you should continue to hold on to shorts and favor the downside.
Overnight inventoryA way of measuring overnight activity in the futures market by just noting how much of the overnight activity happens to fall above the prior day's settlement value (4:15pm EST close) and how much falls below. If more activity is above the settlement, then overnight inventory is said to be net long. If more is below, then it is said to be net short. If all of the overnight activity is above the settlement, then it is said to be 100% net long. If all of the activity is below the settlement then it is said to be 100% net short. The overnight inventory situation matters most and has the most impact on early trade when it is skewed 100% in either direction because when the imbalance is very large like that then the odds of an early correction increase greatly. This is due to the fact that most... is very net long (not 100%) but this has far less import when not trading on a true gapThere is a lot of discussion as to what constitutes a gap. Is it measured to the prior day's close, or to the prior day's high or low? Here at ShadowTrader, we believe that it is always and only to a prior day's high or low, thus creating a true gap or space on the chart between one day and the next. Thus a true gap is one that has price opening completely outside of the prior day's range (either above the high or below the low) and anything else is just a gap that has far less import. As a gap is a "reordering of thinking", only a true gap really changes the tone and creates opportunity to trade earlier (near the open) rather than later. More.
Scenarios
- The potential for a rally is there given my comments above. Use the signpost framework that I discussed in yesterday’s report. The MP graphic above has the gaps and spikeA set of single prints that are created in the last 30 minute session of the day which form at the top or bottom of a range. clearly marked on it. Judge any rally by how many signposts are crossed.
- A cross up into the bottom of the lower gap puts the 2800 top of gap and key psychological level into play as a target. I would expect that any test of that significant figure would be rejected. If internalsInternals refers to “market internals” and is a blanket term to collectively describe the advance decline, breadth, 11 S&P sectors, weighted AD, and iceberg tick More are confirming then this could setup a good counter-trend short against that number. A move up through it puts the spikeA set of single prints that are created in the last 30 minute session of the day which form at the top or bottom of a range. into play. As always think in terms of what should happen once a level is breached.
- Remaining within yesterday’s RTHRegular Trading Hours. In the /ES this means the price action from 9:30am EST to 4:15pm EST only. range maintains the bearish status quo and may signal day timeframe balance and responsive tradeA responsive trade is a counter-trend trade taken against a specific level. The theory is that when two sided trade is taking place, there will not be enough momentum to push past key levels and buyers or sellers will respond to those areas, essentially pushing prices away from them. This is the opposite of breakout or initiative trade which is more directional in nature and is generally taken in the direction of the prevailing trend..
Have a wonderful and profitable day,
Peter
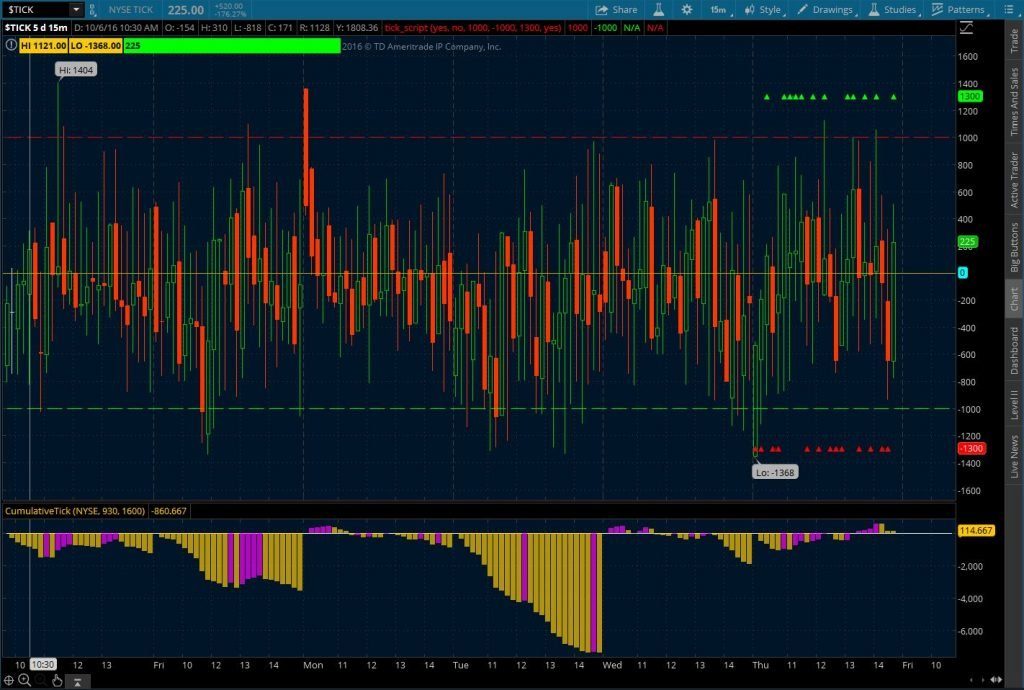
ShadowTrader Cumulative Tick
Beef up your "quad" and by putting your tickThe net cumulative tick reading on the NYSE or Nasdaq Composite. This is measured by the number of stocks ticking up minus the number of stocks ticking down at any given moment. It is the least used of the internal indicators but is discussed from time to time. Generally the tick readings are only helpful when they are at extremes such as +1000 on the NYSE to indicate that program trading is ensuing. indicator on steroids!
Learn More

