ShadowTrader Live Trading Suite FAQs
What is ShadowTrader Live Trading Suite?
Live Trading Suite is a Professional Grade Live Audio and Video Broadcast available through Pro Trading Room software that is embedded into our site. It can also be followed through our dedicated ShadowTrader app which is available in the Apple App Store or Google Play. Live Trading Suite contains two rooms which subscribers receive access to for one price. One room is Stocks & Options and the other is for Futures trading.
Rooted firmly in technical analysis and market profileA way of reading the market that recognizes either time spent or volume traded at a particular price level. A market profile can be either made up of “TPO’s” (time price opportunities), or volume. TPO’s measure how much time was spent at a particular price, while volume-based market profiles measure how much volume traded at a particular price. Generally, market profile is used in the trading of futures, especially the /ES. ShadowTrader utilizes volume based profiles., the Live Trading Suite rooms provide live trades and commentary the entire trading day. Unlike many live trading rooms that put out hypothetical trades, our traders have real money on the line every day and cut and paste their actual fills as real-time alerts. The Stock & Options Room and Futures room schedules are posted in the rooms once per week .
Live Traders:
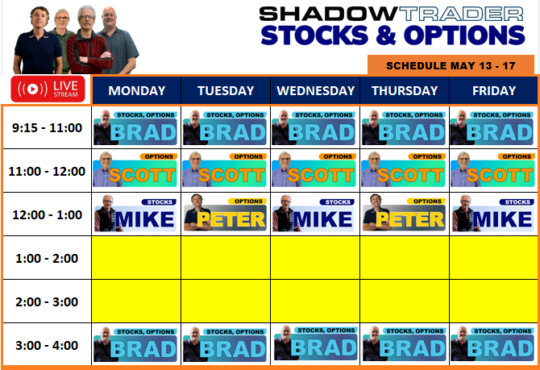
Stocks & Options Room: Brad Augunas, Scott Gillam, Peter Reznicek, and Michael DenBleyker
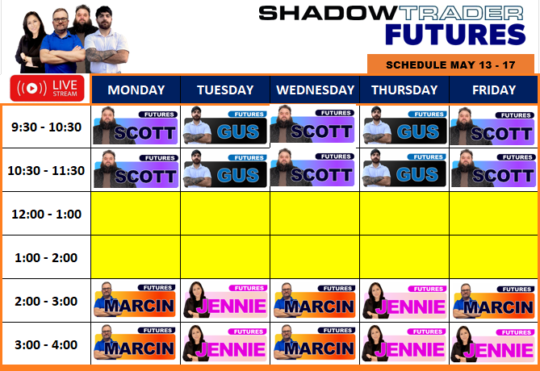
Futures Room: Scott Schneider, Gustavo Lobo, Marcin Delecki, and Jennie Nam
How can I get the Live Trading Suite for free?
Easy. Simply click this link HERE and open and fund a new account with tastytrade. Follow the instructions on that page.
Does Live Trading Suite include Weekly Options Advisory?
No, Live Trading Suite and Weekly Options Advisory are two separate subscriptions. Live Trading Suite subscribers do not have access to Peter’s Weekly Room and vice-versa.
Does the Live Trading Suite include Peter's Premarket Perspective?
Yes, subscribers receive it every morning via email and it’s also posted on our site on a protected page that only subscribers can access. You access this page through the My Account section of the website when logged in.
Where can I get the schedule for the Live Trading Suite rooms?
The schedules are posted into the FILES section of the rooms which are available for view/download by all subscribers. Below are some recent examples.
I am logged in but don't hear any audio and cannot see the screen sharing
This is almost always solved by a simple refresh of the Pro Trading Room. Simply exit the room and come back in. If you are still having issues, contact support@shadowtrader.net
Is there a way to get support quickly in real-time through the Pro Trading Room?
Certainly, click the 3rd tab from the left that says “Support” in the chat section. Mike Coyle who heads up our customer support department is live and available there every day.
What is the market profile software that I see some moderators using?
The software is called WindoTrader and it is the best in class application for charting futures markets using market profileA way of reading the market that recognizes either time spent or volume traded at a particular price level. A market profile can be either made up of “TPO’s” (time price opportunities), or volume. TPO’s measure how much time was spent at a particular price, while volume-based market profiles measure how much volume traded at a particular price. Generally, market profile is used in the trading of futures, especially the /ES. ShadowTrader utilizes volume based profiles.. There is a small discount for ShadowTrader clients at www.windotrader.com/shadowtrader OR call Terry at 702-800-4628 and ask him about the “ShadowTrader Discount”
How do I get the ShadowTrader app for mobile?
The instructions are on the home screen after you enter in the My Account section. If you missed it there, you can also click the cell phone icon in the trading room which is in the upper left hand corner.
How do I cancel my subscription?
To cancel your subscription login at shadowtrader.net and click My Account at the top right. Next, click My Subscriptions on the left hand side menu. Click view on the subscription you wish to cancel. Next, click the cancel button.
You can resubscribe by following the above steps and click the Resubscribe button.
Can alerts be received via email?
No, all alerts are somewhat time sensitive and we feel that the pro trading room software with it’s real-time alerts function is the best way to share this information. When coupled with the ShadowTrader mobile app, you’ll never miss anything this way as you can get access even when away from your desk.
I am outside of the U.S. - Can I still use this service?
YES! Our Pro Trading Room desktop application and dedicated mobile phone app work perfectly wherever you are in the world as long as you have an internet connection.
How can I search for a particular trade or alert?
In the alerts section which is in the upper left of the desktop version, click the little gear icon and type whatever you want to search for such as a trade number or symbol into the window and press enter. All alerts that contain whatever you searched for will display in the window. To go back to the normal view of all alerts, simply click the “x” in the search window.
Can I mute the broadcast?
Yes, you can slick the little speaker icon in the upper right which is next to the refresh icon. In the dropdown, click the blue MUTE button.
Can I set which alert sounds I want to hear and mute others?
Yes, click the speaker icon in the upper right and check/uncheck the applicable boxes in the drop down menu.
How do I make sure that I am viewing the same screen that is being discussed?
If a moderator is sharing multiple screens then all of those screens will appear as tabs at the top of your application. Simply click on the appropriate tab to display that screenshare.
Weekly Options Advisory FAQs
How can I better understand the trade alerts?
It is imperative that everyone read the “How to Understand Trade Alerts” pdf which is emailed out to all subscribers when they sign up. The document also resides in the FILES section of the Pro Trading Room and is also linked in the nightly email. New members should also read the “Weekly Options Advisory Playbook” which is also in FILES section of the room.
Are Peter's live sessions recorded?
Yes. The recordings are usually posted before the end of the day in the alerts section of the room.
How much capital is required to do all of Peter's trades?
Peter recommends having at least $50,000 of unmargined capital to follow along with all the trades. That being said, almost every trade posted can be modified to require less margin and risk. If a trade calls for a naked single option, smaller traders can trade it as a wide vertical instead. By the same token, ratio spreads can easily become broken wing butterflies which are less risky and margin intensive. Many subscribers have reported great success to us by simply choosing different spreads which are still in the “spirit of the trade”.
Where is the track record for the advisory located?
Every single transaction that has ever been posted as a real-time alert is recorded in a spreadsheet which is turned into a .pdf and emailed out nightly to subscribers in the 4pm email. The document is also updated daily in the FILES section of the Pro Trading Room.
How many trades per week can I expect from this advisory?
Peter usually has anywhere from two to eight live trades going at any given time. The market decides how active he will be.
How can I reach Peter directly?
His email is asktheshadow@shadowtrader.net
How do I cancel my subscription?
To cancel your subscription login at shadowtrader.net and click My Account at the top right. Next, click My Subscriptions on the left hand side menu. Click view on the subscription you wish to cancel. Next, click the cancel button.
ThinkScripts FAQs
Are the scripts you sell subscriptions or one-time purchases?
Every script we sell is a one-time purchase. Once you buy it, the code is yours to keep forever and there is never an additional charge. As it is impossible for us to “lock” the scripts, all we ask is that they not be shared with anyone else.
How do I install the scripts on my thinkorswim platform?
All thinkscripts come with installation videos which detail how to get the scripts into your trading platform. The quick overview of how to do it follows below:
- Click the little flask icon on the chart that you wish to put the script into.
- This opens up the “Edit Studies and Strategies” box
- Click the “Create…” button in the lower left underneath the list of studies.
- This opens up the “New script” box.
- The first line of code defaults to “1. plot Data = close;” – Delete this line
- Copy the code for your newly purchased script from the protected page that you can access after you buy.
- Paste the code into the thinkScript editor box where you just deleted that first line earlier. If it’s correct then it will be a mix of purple, green and white. If you might have missed something in your cut and paste, the script will have red portions indicating an error. It’s best to just delete everything and start over.
- In the title field at the top where it says “NewStudy1” change the name to the name of the product like “Iceberg Tick” or whatever name you would like to give it.
- Click the green “OK” button
- When the editor box disappears, click “Apply” on the Edit Studies and Strategies screen
- If you want to change any of the parameters of the script (like what colors to display, etc) then click the flask icon again and then click the little gear to the right of your script in the “Added studies and strategies” list. That gear will open up all the settings that you can change for that particular script.
How do I set up the market internals "quad" screen on my tastytrade platform?
Along the left hand side just to the right of the WATCHLISTS section, there are icons running from top to bottom. Click the fifth one from the top which has four little white squares arranged to look like a window with panes. That will open up four charts that are two across and two down.
In the upper two boxes, enter the symbols “$VOLD” for the breadthDescribing market breadth in terms of volume for the NYSE or the Nasdaq. This is a figure composed of the net sum of the amount of volume flowing into up stocks minus the amount of volume flowing into down stocks at any given moment in each of the two respective markets. Often the advance decline line is also referred to as “breadth”, but ShadowTrader differentiates between the two by using two separate terms. Generally, the Breadth is more important than the advance decline line. and “$ADD” for the advance declineThe advance decline line for the NYSE or Nasdaq. This is a figure composed of a net sum of the number of advancing stocks minus the number of declining stocks at any given moment in each of the two respective markets. line.
In the lower two boxes, enter “$TICK” for the NYSE TickThe net cumulative tick reading on the NYSE or Nasdaq Composite. This is measured by the number of stocks ticking up minus the number of stocks ticking down at any given moment. It is the least used of the internal indicators but is discussed from time to time. Generally the tick readings are only helpful when they are at extremes such as +1000 on the NYSE to indicate that program trading is ensuing. in one box and “/ESM3” or whatever is the symbol for the current front month of S&P e-mini futures.
What extra scripts can I add to enhance the quad screen?
For the thinkorswim platform we offer four different scripts that you can add to enhance the quad. These are available in our store under the FREE thinkscripts section.
I note that you mostly discuss NYSE internals, what are the symbols for Nasdaq Internals?
For tastytrade, all of the available market internalsA blanket term to collectively describe the advance decline, breadth, 11 S&P sectors, weighted AD, and iceberg tick More symbols are available HERE.
On the thinkorswim platform, simply open the public watchlist titled “InternalsInternals refers to “market internals” and is a blanket term to collectively describe the advance decline, breadth, 11 S&P sectors, weighted AD, and iceberg tick More and Indicators” for a complete list of what is available.
Peters Premarket Perspective FAQs
What is the best way to get up to speed on market profile?
Peter always recommends starting with James Dalton’s seminal work on the topic, Mind Over Markets. There is also a second book, Markets in Profile which is excellent as well. We also recommend that you mouse over all of the terms in the report that you don’t understand and read the tool tips that pop up. All of the terms also reside in our glossary HERE.
How do I understand what all of the numbers, letters, colors, etc on Peter's market profile graphics mean?
There is a market profile keyA key to understanding the market profile as Peter plots it using WindoTrader. under the chart in every issue. Click HERE to view it.
Are the Key Levels just for the current day or can they still be of use in subsequent sessions?
Key levels are usually only active for the current day but in many situations should be carried forward if not tested in the current session. A good example of this would be a point of controlAlso called “POC” for short. The level in the futures inside the value area where either the greatest amount of volume traded in the prior session, or the greatest amount of time was spent as measured by the number of TPO’s going across. Measured this way, the POC would be the widest part of any given market profile. While ShadowTrader calculates its value areas and points of control using volume exclusively, we are always very aware of where the TPO POC is and it’s relation to current prices or patterns in the profile. Both are very important. that never gets traded through. This POCPoint of Control, also known as the "fairest price to do business". It is the price level in the /ES where the greatest amount of volume in the prior RTH session traded. ShadowTrader measures the POC using volume but the traditional way is to mark off the widest point of the day's distribution where the most TPO's printed going across from left to right, indicating that that was the price where the most time was spent. It's important to pay attention to both the volume POC and the TPO POC. now becomes a VPOCVirgin Point of Control. This is a point of control level that has not yet been tested (traded through) during an RTH session. If the POC gets tested during an overnight session, it does not count and remains "virgin" until it happens during a day session. (Virgin Point of ControlAlso called “POC” for short. The level in the futures inside the value area where either the greatest amount of volume traded in the prior session, or the greatest amount of time was spent as measured by the number of TPO’s going across. Measured this way, the POC would be the widest part of any given market profile. While ShadowTrader calculates its value areas and points of control using volume exclusively, we are always very aware of where the TPO POC is and it’s relation to current prices or patterns in the profile. Both are very important.) and should be carried forward in your narrative for potentially being in play in a subsequent session.
How long should we carry forward VPOC's that haven't been tested?
A good rule of thumb is to keep them on your charts and in your narrative until the contract flips in the next quarter. Trying to match up new contract prices with older VPOCs that were created in an older contract is often difficult because the new contract traded very low volume around those areas.
How do I cancel my subscription?
To cancel your subscription login at shadowtrader.net and click My Account at the top right. Next, click My Subscriptions on the left hand side menu. Click view on the subscription you wish to cancel. Next, click the cancel button.


