The Market Profile value areas and ShadowTrader Pivots for /ESH19 and /NQH19 Futures are posted free every morning
in the ShadowTrader Swing Trader newsletter.
Good Morning
If you are here through Terry at WindoTrader, this is the final free issue. It’s been a pleasure sharing this information with you and I hope that I can count you as a subscriber in the near future. If you have any questions at all, feel free to contact me at asktheshadow@shadowtrader.net.
Some surprising news yesterday afternoon that the govt. is considering easing tariffs on China to calm the markets. S&P futures rallied hard on that, fell back to almost where they started, then commenced a slow climb higher which is still in effect as we go to press here. Let’s have a look at the marketIf ShadowTrader is initiating a position “at the market” it simply means that limit orders are not being used and the position is being entered with no regard to price. This is used much more often on more liquid Nasdaq issues.<market profileA way of reading the market that recognizes either time spent or volume traded at a particular price level. A market profile can be either made up of “TPO’s” (time price opportunities), or volume. TPO’s measure how much time was spent at a particular price, while volume-based market profiles measure how much volume traded at a particular price. Generally, market profile is used in the trading of futures, especially the /ES. ShadowTrader utilizes volume based profiles. coming into today’s session…..

Purposely taking the snapshot this morning more close up so as to focus on yesterday’s structure. It was thin and emotional with an excess highA high characterized by a number of single prints that ends a move and is at the top of a daily market profile distribution. The minimum number of TPO's that is necessary to define an excess high is two, however when the excess has only a few TPO's, it is said to be "lack of material excess". An excess high is the opposite of a poor high, which has no single prints and is flat along the high where the TPO's line up next to each other.. The overnight session has moved above that RTHRegular Trading Hours. In the /ES this means the price action from 9:30am EST to 4:15pm EST only. high and thus we will carry forward that we don’t expect that to be the high of the move. Could be, but odds generally favor auctions ending in RTHRegular Trading Hours. In the /ES this means the price action from 9:30am EST to 4:15pm EST only. sessions.
Overnight inventoryA way of measuring overnight activity in the futures market by just noting how much of the overnight activity happens to fall above the prior day's settlement value (4:15pm EST close) and how much falls below. If more activity is above the settlement, then overnight inventory is said to be net long. If more is below, then it is said to be net short. If all of the overnight activity is above the settlement, then it is said to be 100% net long. If all of the activity is below the settlement then it is said to be 100% net short. The overnight inventory situation matters most and has the most impact on early trade when it is skewed 100% in either direction because when the imbalance is very large like that then the odds of an early correction increase greatly. This is due to the fact that most... is about 90% net long. 2649.25 is the ONHOvernight High. A term mostly used in describing the futures market which has an overnight session and trades almost around the clock. To be precise, in the /ES this is the high made between 4:30pm EST and 9:30am EST the next day. and is the upside reference. An early failure to take it could result in a liquidation breakA sudden selloff in the market that has the following characteristics:
-Often happens very early or late in the day
-Comes out of a pattern that doesn’t suggest such a break should occur
-Has no definitive catalyst or news that drives it
-Has much faster tempo than the one that has already been established
-Is often short-lived and will retrace 100% soon after or the next day
A liquidation break happens when short term traders get overly long and all panic out at once. It is different from a stronger, more lasting correction in that there are usually only very short timeframe players involved, usually those who got most recently long at poor location. (fadeWhen a stock moves opposite the direction of its gap on an intraday basis) back through some of the single printsAny section of the market profile distribution that is only one TPO wide. Single prints are a sign of emotional buying or selling as very little time was spent at those levels and thus there is no value there. The endpoints of single print sections are considered to be potential support or resistance points. at the top of yesterday’s range. As of now we are trading on a true gapThere is a lot of discussion as to what constitutes a gap. Is it measured to the prior day's close, or to the prior day's high or low? Here at ShadowTrader, we believe that it is always and only to a prior day's high or low, thus creating a true gap or space on the chart between one day and the next. Thus a true gap is one that has price opening completely outside of the prior day's range (either above the high or below the low) and anything else is just a gap that has far less import. As a gap is a "reordering of thinking", only a true gap really changes the tone and creates opportunity to trade earlier (near the open) rather than later. More which is very small of just a couple of points away from the RTHRegular Trading Hours. In the /ES this means the price action from 9:30am EST to 4:15pm EST only. high. If such a fadeWhen a stock moves opposite the direction of its gap on an intraday basis was to develop, target 2639.25 which is the base of the excess single printsAny section of the market profile distribution that is only one TPO wide. Single prints are a sign of emotional buying or selling as very little time was spent at those levels and thus there is no value there. The endpoints of single print sections are considered to be potential support or resistance points. and then VAHValue Area High at 2636.50. Further weakness would probably look for the volume POCPoint of Control, also known as the "fairest price to do business". It is the price level in the /ES where the greatest amount of volume in the prior RTH session traded. ShadowTrader measures the POC using volume but the traditional way is to mark off the widest point of the day's distribution where the most TPO's printed going across from left to right, indicating that that was the price where the most time was spent. It's important to pay attention to both the volume POC and the TPO POC. at 2635.00 and possibly halfbackA term for the halfway point between the high and low of any session, could be a day session or an overnight session. On Peter's market profile charts it is always a dark yellow horizontal line at that level. at 2625.50.
The volume was light for the later part of the session as shorts were squeezed on that news. Note the volume at the different price levels that runs alongside the distribution. Emotional short covering is what is happening there.
On the upside, there are two main levels which could be in play today if prices can move above the ONHOvernight High. A term mostly used in describing the futures market which has an overnight session and trades almost around the clock. To be precise, in the /ES this is the high made between 4:30pm EST and 9:30am EST the next day.. Those would be the round number 2650.00 and the VPOCVirgin Point of Control. This is a point of control level that has not yet been tested (traded through) during an RTH session. If the POC gets tested during an overnight session, it does not count and remains "virgin" until it happens during a day session. at 2652.00. It’s too far to the left to see, but this VPOCVirgin Point of Control. This is a point of control level that has not yet been tested (traded through) during an RTH session. If the POC gets tested during an overnight session, it does not count and remains "virgin" until it happens during a day session. is from the 12/13/18 session. Both could be in play today. How the market acts around the key 2650 level will be of most importance today. My first inclination is that it will have difficulty resolving it. If it doesn’t then it’s a sign of strength or rather melt-up as the case may be. It is options expiry today so a grind around that 2650 on middling internalsInternals refers to “market internals” and is a blanket term to collectively describe the advance decline, breadth, 11 S&P sectors, weighted AD, and iceberg tick More could easily be in the cards for today’s session. Keep that squarely in mind if you are trading in the day timeframe.
Yesterday’s action was very interesting as it came right at some very pivotal technical resistance in the SPX and NDX. As I’ve been discussing in recent ShadowTrader Video Weeklies, the NDX is right at main down trend line resistance and the SPX was at a key Fibonacci resistance yesterday. The surprise news took both of those indices above those levels. We are also trading just inside the base of the “box area” that I talked about at length while it was forming in November. There should be resistance here but as of now it appears that it is being ignored. I’ll leave you with a daily chart of the SPX cash that hopefully gives more perspective on exactly where we are.
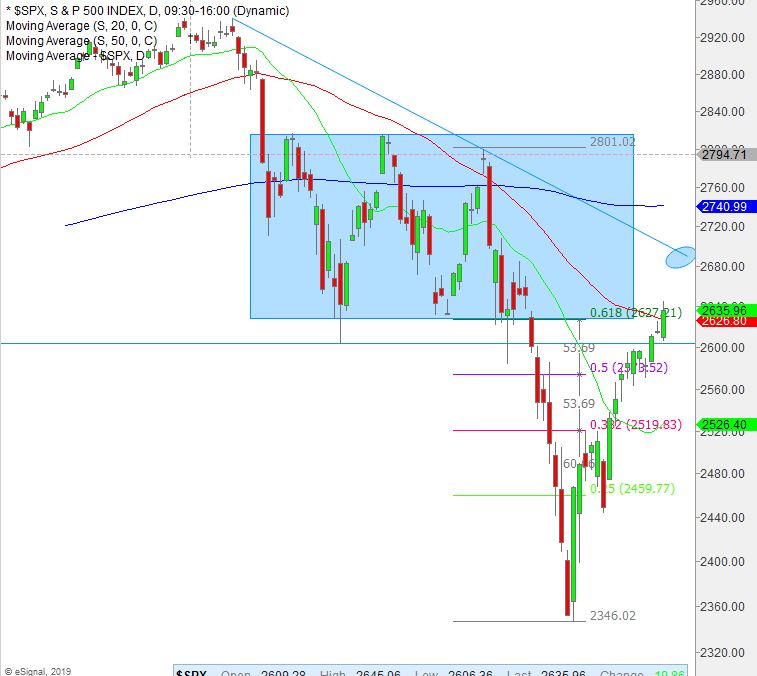
SPX – Daily with box and Fibonacci retracement from 12/3 high to 12/26 low
Many more nuances and details to come in this weekend’s video…….
This newsletter is available in your inbox every day at 9am sharp for $20 per month SIGN UP HERE
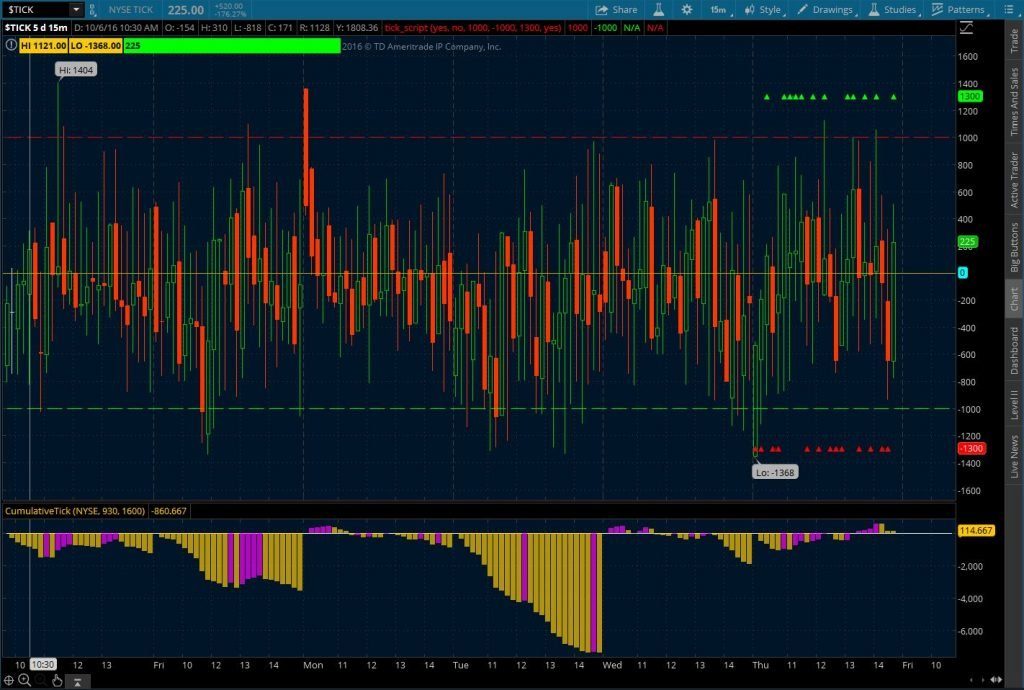
ShadowTrader Cumulative Tick
Beef up your "quad" and by putting your tickThe net cumulative tick reading on the NYSE or Nasdaq Composite. This is measured by the number of stocks ticking up minus the number of stocks ticking down at any given moment. It is the least used of the internal indicators but is discussed from time to time. Generally the tick readings are only helpful when they are at extremes such as +1000 on the NYSE to indicate that program trading is ensuing. indicator on steroids!
Learn MoreHave a nice day,
-peter


