
- Consider both shortened RTHRegular Trading Hours. In the /ES this means the price action from 9:30am EST to 4:15pm EST only. sessions to be all part of the overnight distribution
- Our market profileA way of reading the market that recognizes either time spent or volume traded at a particular price level. A market profile can be either made up of “TPO’s” (time price opportunities), or volume. TPO’s measure how much time was spent at a particular price, while volume-based market profiles measure how much volume traded at a particular price. Generally, market profile is used in the trading of futures, especially the /ES. ShadowTrader utilizes volume based profiles. references are all from the Wednesday, Nov 22 session
- The ONLOvernight Low. A term mostly used for the futures market as it trades almost around the clock. To be precise, in the /ES this would be the lowest price between 4:30pm EST and 9:30am EST the next day. in the /ES was formed right when the /NQ came exactly to a nuanced technical level and bounced pretty hard. This tell us that momentum longs (short term) are still in control
- Potential for meaningful change can only appear below that weak ONLOvernight Low. A term mostly used for the futures market as it trades almost around the clock. To be precise, in the /ES this would be the lowest price between 4:30pm EST and 9:30am EST the next day.
| Pre Market Indications | ||
| Opening In/Out Balance | in balance | |
| Overnight InventoryA way of measuring overnight activity in the futures market by just noting how much of the overnight activity happens to fall above the prior day's settlement value (4:15pm EST close) and how much falls below. If more activity is above the settlement, then overnight inventory is said to be net long. If more is below, then it is said to be net short. If all of the overnight activity is above the settlement, then it is said to be 100% net long. If all of the activity is below the settlement then it is said to be 100% net short. The overnight inventory situation matters most and has the most impact on early trade when it is skewed 100% in either direction because when the imbalance is very large like that then the odds of an early correction increase greatly. This is due to the fact that most... | balanced | |
| Current Price/Overnight Range | middle third | |
| Shock and AweA term Peter uses to describe what overnight futures traders may be feeling when faced with an open that is wildly divergent from what they expected. Large gaps in either direction that are opening well outside of range are examples of this. The approach is that when the market opens in such a manner, there is often opportunity to trade earlier rather than later because of the large contingent of traders who will be forced to reverse their positions quickly. | no | |
| Potential for Early Trade | no | |
| Short Term Bias | bullish | |
Scenarios
- I’m carrying that /NQ low into that daily 8EMA into my narrative and assuming /ES pullbacks are buyable as long as trade is above the ONLOvernight Low. A term mostly used for the futures market as it trades almost around the clock. To be precise, in the /ES this would be the lowest price between 4:30pm EST and 9:30am EST the next day..
- AcceptanceWhen the market profile begins to build out or develop in a certain area, it is said that the market is accepting those prices. This can be measured either in time spent or amount of volume that is transacted. It is generally understood that ShadowTrader defines acceptance as more of a time dynamic than a volume one. A good rule of thumb is to look for at least two TPO periods to print in the accepted area. The acceptance confirms that a significant amount of market participants are transacting at those levels. Acceptance is the opposite of rejection. More below the ONLOvernight Low. A term mostly used for the futures market as it trades almost around the clock. To be precise, in the /ES this would be the lowest price between 4:30pm EST and 9:30am EST the next day. has potential to change the tone. This would also put the recent VPOCVirgin Point of Control. This is a point of control level that has not yet been tested (traded through) during an RTH session. If the POC gets tested during an overnight session, it does not count and remains "virgin" until it happens during a day session. below us into play as a target.
- Do not discount the potential for balance at these levels. The market is still very short term overbought without any meaningful liquidation in some time. You’ll know it’s balance by the slower tempoProbably one of the most important and yet overlooked concepts in the market. The tempo is simply the ‘speed’ at which the market is moving. This is also referred to as confidence. Slow tempo is typical of range bound days where there is lots of responsive activity. Fast tempo occurs when there is initiating activity, and market is breaking out of a range. This is not to say that the market can’t have fast tempo on days when it is rotational or moving between the extremes of a value area. It certainly can. Effective intraday futures trading involves gauging the tempo and knowing that opportunities are fewer and smaller when the tempo is slow. See S.O.H., mixed internalsInternals refers to “market internals” and is a blanket term to collectively describe the advance decline, breadth, 11 S&P sectors, weighted AD, and iceberg tick More, and acceptanceWhen the market profile begins to build out or develop in a certain area, it is said that the market is accepting those prices. This can be measured either in time spent or amount of volume that is transacted. It is generally understood that ShadowTrader defines acceptance as more of a time dynamic than a volume one. A good rule of thumb is to look for at least two TPO periods to print in the accepted area. The acceptance confirms that a significant amount of market participants are transacting at those levels. Acceptance is the opposite of rejection. More within the RTHRegular Trading Hours. In the /ES this means the price action from 9:30am EST to 4:15pm EST only. range (Wednesday).
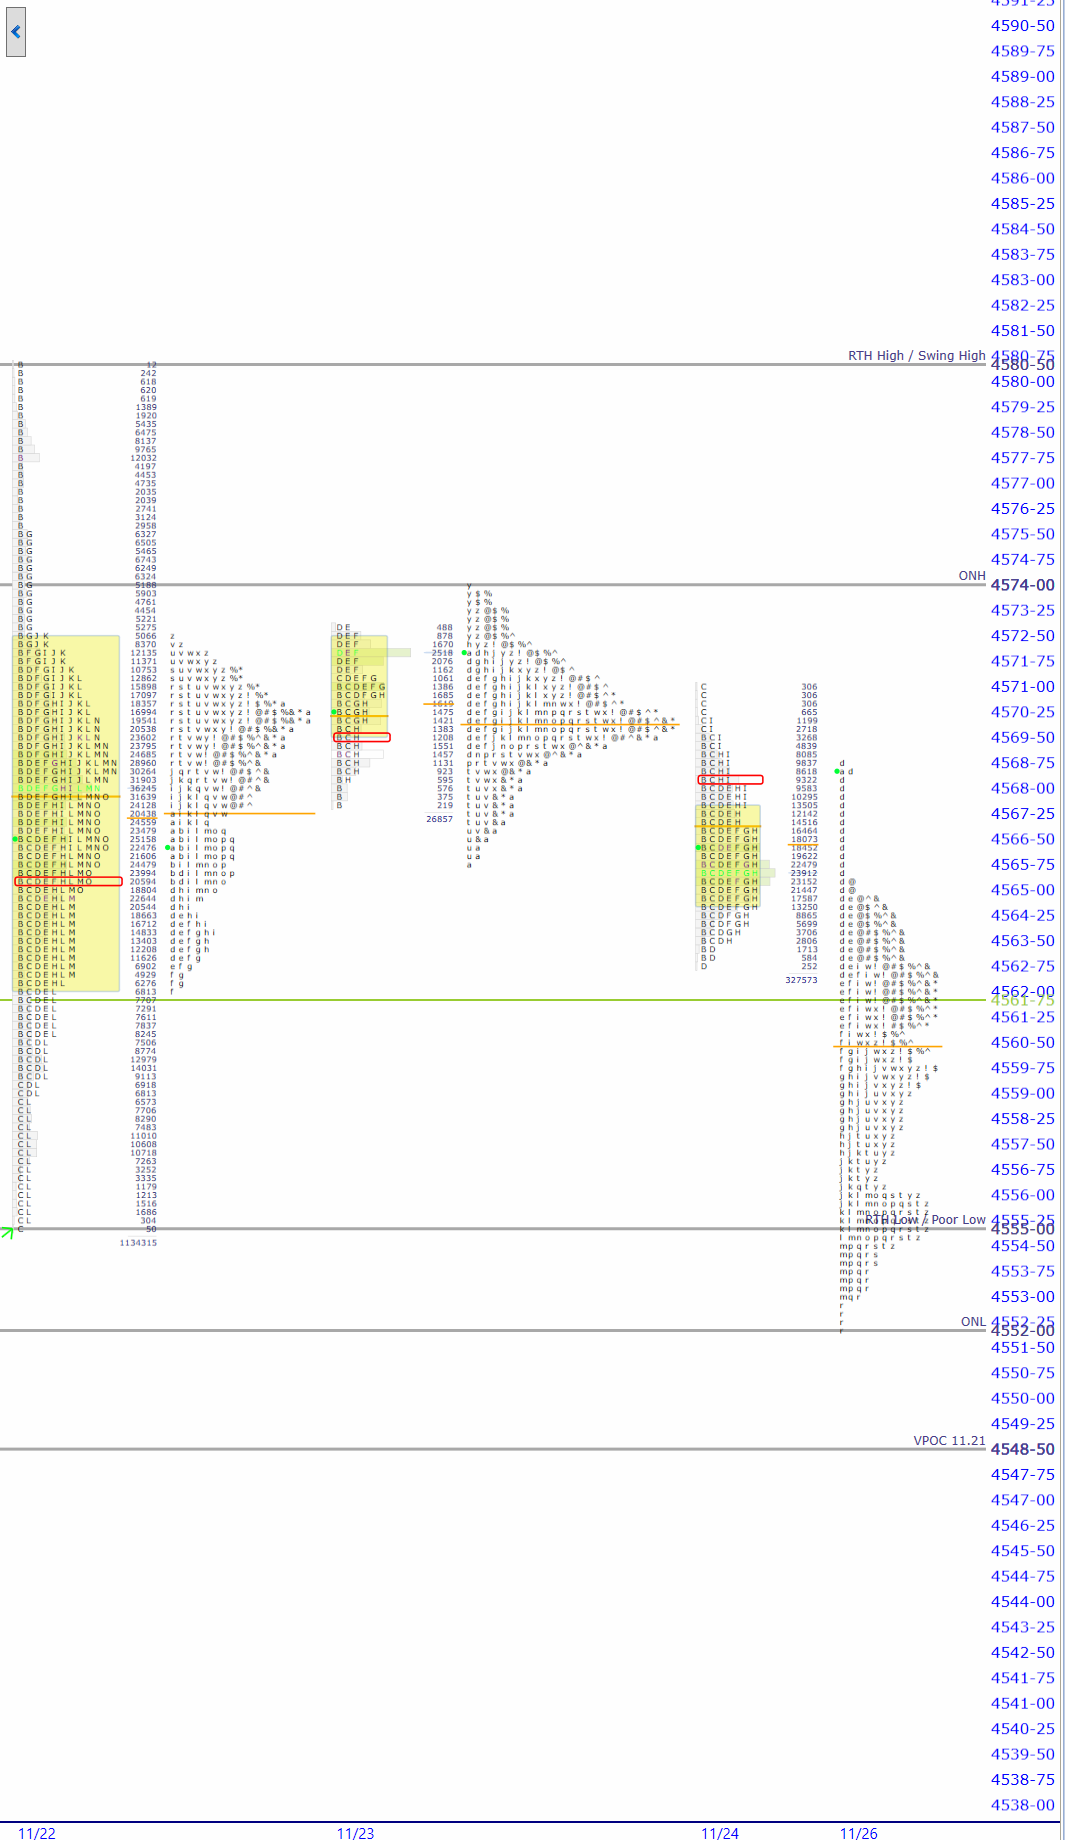
| Today’s Market ProfileA way of reading the market that recognizes either time spent or volume traded at a particular price level. A market profile can be either made up of “TPO’s” (time price opportunities), or volume. TPO’s measure how much time was spent at a particular price, while volume-based market profiles measure how much volume traded at a particular price. Generally, market profile is used in the trading of futures, especially the /ES. ShadowTrader utilizes volume based profiles. Chart |
The chart provided is from WindoTrader. CLICK HERE to learn more about the ShadowTrader discount. Interpret the chart above with the Market Profile Key.
| Key Levels for Today | ||
| 4580.50 | RTHRegular Trading Hours. In the /ES this means the price action from 9:30am EST to 4:15pm EST only. High / Swing High | |
| 4574.00 | ONHOvernight High. A term mostly used in describing the futures market which has an overnight session and trades almost around the clock. To be precise, in the /ES this is the high made between 4:30pm EST and 9:30am EST the next day. | |
| 4555.00 | RTHRegular Trading Hours. In the /ES this means the price action from 9:30am EST to 4:15pm EST only. Low / Poor LowA poor low is one which lacks excess and is the opposite of an excess low. A poor low will have less than two TPO's of excess at the bottom of a daily range with at least 2-3 columns of TPO's lining up to form a flat looking bottom. It indicates that there are short term or weak handed shorts at that low of day area. We know this because every time prices sell off to the low, they get covered quickly, thus forming the poor low. The poor low has two forward looking indications. The first is that prices should bounce away from the poor low as there are a number of shorts trapped at poor location. The second is that if the next day or in some subsequent session, the poor low is revisited, then the odds are strong that it will break and move lower. This is called repair as it repairs the ... | |
| 4552.00 | ONLOvernight Low. A term mostly used for the futures market as it trades almost around the clock. To be precise, in the /ES this would be the lowest price between 4:30pm EST and 9:30am EST the next day. | |
| 4548.50 | VPOCVirgin Point of Control. This is a point of control level that has not yet been tested (traded through) during an RTH session. If the POC gets tested during an overnight session, it does not count and remains "virgin" until it happens during a day session. 11.21 | |
| Virgin Point of ControlAlso called “POC” for short. The level in the futures inside the value area where either the greatest amount of volume traded in the prior session, or the greatest amount of time was spent as measured by the number of TPO’s going across. Measured this way, the POC would be the widest part of any given market profile. While ShadowTrader calculates its value areas and points of control using volume exclusively, we are always very aware of where the TPO POC is and it’s relation to current prices or patterns in the profile. Both are very important. (VPOCVirgin Point of Control. This is a point of control level that has not yet been tested (traded through) during an RTH session. If the POC gets tested during an overnight session, it does not count and remains "virgin" until it happens during a day session.) | ||
| 11.21.2023 | 4548.50 | |
| 11.13.2023 | 4425.75 | |
| 11.09.2023 | 4362.00 | |
| 11.02.2023 | 4336.00 | |
| 10.24.2023 | 4270.50 | |
| 11.01.2023 | 4256.50 | |
| 10.31.2023 | 4211.75 | |
| 10.27.2023 | 4132.00 | |
| Today’s ESThe S&P 500 e-mini contract. In the broadcast we use this as our primary instrument to define market direction and effect short term trades when we have a bias in the market. This is the electronic contract that trades around the clock, as opposed to the pit traded contract. Sometimes the pit traded version is called the “big contract”. Futures contracts on are denoted by two letters and then a letter and a number to define their expiration month. The ES has four contract periods per year which expire in March, June, September, and December. These four months are denoted by the letters H, M, U, and Z. For example, if it was 2012, then the March contract would be called the /ESH2. Thinkorswim requires a forward slash before the letters. Certain trading platforms and charting packages ma... and NQThe Nasdaq 100 E-Mini futures. In the broadcast we only discuss this contract in the pre-market to get a feel for where the Nasdaq will open. Market ProfileA way of reading the market that recognizes either time spent or volume traded at a particular price level. A market profile can be either made up of “TPO’s” (time price opportunities), or volume. TPO’s measure how much time was spent at a particular price, while volume-based market profiles measure how much volume traded at a particular price. Generally, market profile is used in the trading of futures, especially the /ES. ShadowTrader utilizes volume based profiles. and Pivot Point Numbers | ||
| Value Area HighThe high end of the range of the value area. | 4572.50 | 16100.00 |
| Point of ControlAlso called “POC” for short. The level in the futures inside the value area where either the greatest amount of volume traded in the prior session, or the greatest amount of time was spent as measured by the number of TPO’s going across. Measured this way, the POC would be the widest part of any given market profile. While ShadowTrader calculates its value areas and points of control using volume exclusively, we are always very aware of where the TPO POC is and it’s relation to current prices or patterns in the profile. Both are very important. | 4568.00 | 16057.00 |
| Value Area LowThe low end of the range of the value area. | 4562.00 | 16036.00 |
| R3 | 4605.50 | 16314.50 |
| R2 | 4593.00 | 16244.00 |
| R1 | 4580.00 | 16146.50 |
| Pivot | 4567.50 | 16076.00 |
| S1 | 4554.50 | 15978.50 |
| S2 | 4542.00 | 15908.00 |
| S3 | 4529.00 | 15810.50 |


