
- True gapThere is a lot of discussion as to what constitutes a gap. Is it measured to the prior day's close, or to the prior day's high or low? Here at ShadowTrader, we believe that it is always and only to a prior day's high or low, thus creating a true gap or space on the chart between one day and the next. Thus a true gap is one that has price opening completely outside of the prior day's range (either above the high or below the low) and anything else is just a gap that has far less import. As a gap is a "reordering of thinking", only a true gap really changes the tone and creates opportunity to trade earlier (near the open) rather than later. More higher on 100% net long overnight inventoryA way of measuring overnight activity in the futures market by just noting how much of the overnight activity happens to fall above the prior day's settlement value (4:15pm EST close) and how much falls below. If more activity is above the settlement, then overnight inventory is said to be net long. If more is below, then it is said to be net short. If all of the overnight activity is above the settlement, then it is said to be 100% net long. If all of the activity is below the settlement then it is said to be 100% net short. The overnight inventory situation matters most and has the most impact on early trade when it is skewed 100% in either direction because when the imbalance is very large like that then the odds of an early correction increase greatly. This is due to the fact that most...
- As always, judege the early bias by amount of fadeWhen a stock moves opposite the direction of its gap on an intraday basis and whether or not acceptanceWhen the market profile begins to build out or develop in a certain area, it is said that the market is accepting those prices. This can be measured either in time spent or amount of volume that is transacted. It is generally understood that ShadowTrader defines acceptance as more of a time dynamic than a volume one. A good rule of thumb is to look for at least two TPO periods to print in the accepted area. The acceptance confirms that a significant amount of market participants are transacting at those levels. Acceptance is the opposite of rejection. More can be found inside of range
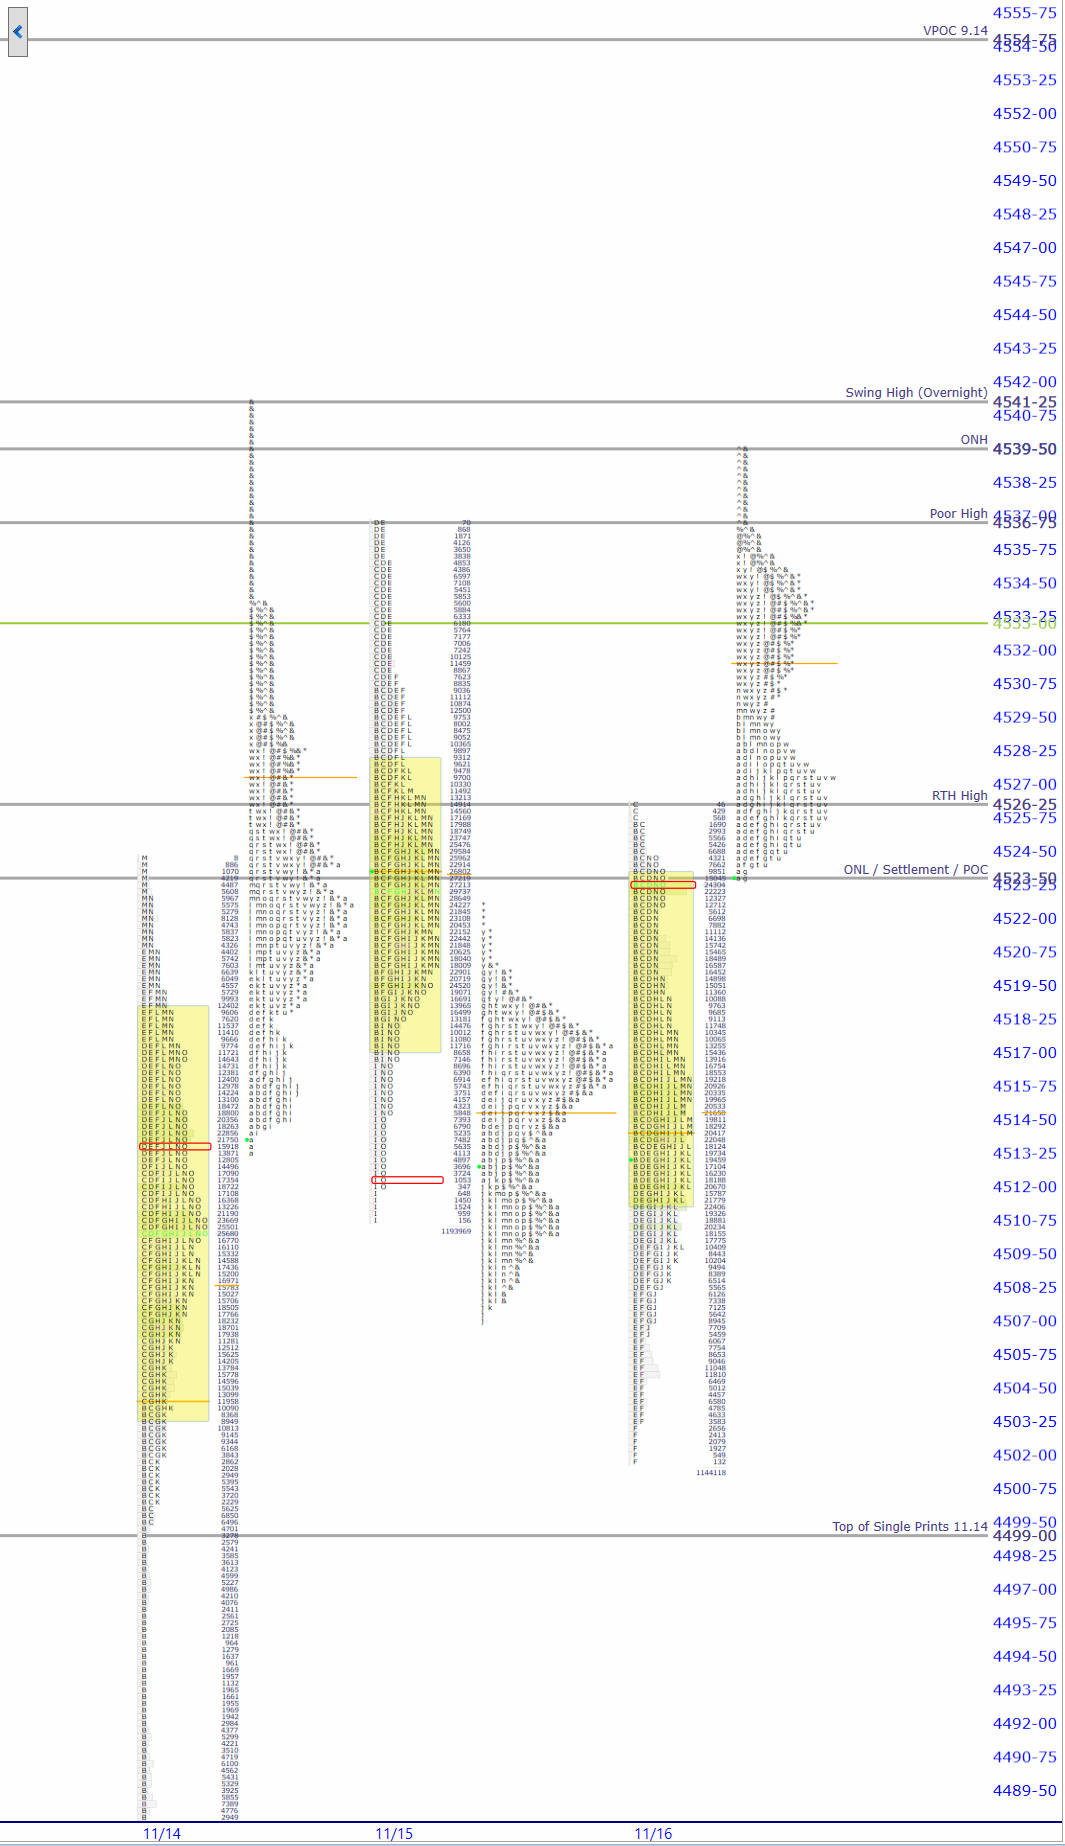
- Yesterday’s RTHRegular Trading Hours. In the /ES this means the price action from 9:30am EST to 4:15pm EST only. activity failed to even test the first of a lot of poor structure below (Top of Single PrintsAny section of the market profile distribution that is only one TPO wide. Single prints are a sign of emotional buying or selling as very little time was spent at those levels and thus there is no value there. The endpoints of single print sections are considered to be potential support or resistance points. from 11.14)
| Pre Market Indications | ||
| Opening In/Out Balance | out of balance | |
| Overnight InventoryA way of measuring overnight activity in the futures market by just noting how much of the overnight activity happens to fall above the prior day's settlement value (4:15pm EST close) and how much falls below. If more activity is above the settlement, then overnight inventory is said to be net long. If more is below, then it is said to be net short. If all of the overnight activity is above the settlement, then it is said to be 100% net long. If all of the activity is below the settlement then it is said to be 100% net short. The overnight inventory situation matters most and has the most impact on early trade when it is skewed 100% in either direction because when the imbalance is very large like that then the odds of an early correction increase greatly. This is due to the fact that most... | 100% net long | |
| Current Price/Overnight Range | upper third | |
| Shock and AweA term Peter uses to describe what overnight futures traders may be feeling when faced with an open that is wildly divergent from what they expected. Large gaps in either direction that are opening well outside of range are examples of this. The approach is that when the market opens in such a manner, there is often opportunity to trade earlier rather than later because of the large contingent of traders who will be forced to reverse their positions quickly. | yes | |
| Potential for Early Trade | yes | |
| Short Term Bias | bullish | |
Scenarios
- 100% net long o/n inventory and true gapThere is a lot of discussion as to what constitutes a gap. Is it measured to the prior day's close, or to the prior day's high or low? Here at ShadowTrader, we believe that it is always and only to a prior day's high or low, thus creating a true gap or space on the chart between one day and the next. Thus a true gap is one that has price opening completely outside of the prior day's range (either above the high or below the low) and anything else is just a gap that has far less import. As a gap is a "reordering of thinking", only a true gap really changes the tone and creates opportunity to trade earlier (near the open) rather than later. More higher means look for the fadeWhen a stock moves opposite the direction of its gap on an intraday basis first. Sellers don’t have much control currently so passing on that may be the best course of action.
- The ONLOvernight Low. A term mostly used for the futures market as it trades almost around the clock. To be precise, in the /ES this would be the lowest price between 4:30pm EST and 9:30am EST the next day. area should be considered secure until it’s not. There is a 45 degree lineThe 45 degree line is an interesting market profile nuance. It occurs when a 45 degree line can be drawn from the lowest point of a distribution to its widest point (TPO POC). This is a sign that sellers have painted themselves into a corner near the lows of the session and creates potential for an upward reversal in the next session. As less and less time is spent the closer you get to the low of the session, sellers are essentially initiating shorts at less and less value. 45 degree line lows should be assumed to be secure until they are breached. The pattern is generally only noted in RTH sessions but they have shown to be relatively reliable signals in overnight sessions as well. The obvious question is always whether or not the 45 degree line can be drawn in from the high of the day t... there. Should it be tested, it may also be weak since it is also at the settlement and POCPoint of Control, also known as the "fairest price to do business". It is the price level in the /ES where the greatest amount of volume in the prior RTH session traded. ShadowTrader measures the POC using volume but the traditional way is to mark off the widest point of the day's distribution where the most TPO's printed going across from left to right, indicating that that was the price where the most time was spent. It's important to pay attention to both the volume POC and the TPO POC..
- The recent swing high in the overnight session is the upside target on strength.
| Today’s Market ProfileA way of reading the market that recognizes either time spent or volume traded at a particular price level. A market profile can be either made up of “TPO’s” (time price opportunities), or volume. TPO’s measure how much time was spent at a particular price, while volume-based market profiles measure how much volume traded at a particular price. Generally, market profile is used in the trading of futures, especially the /ES. ShadowTrader utilizes volume based profiles. Chart |
The chart provided is from WindoTrader. CLICK HERE to learn more about the ShadowTrader discount. Interpret the chart above with the Market Profile Key.
| Key Levels for Today | ||
| 4554.75 | VPOCVirgin Point of Control. This is a point of control level that has not yet been tested (traded through) during an RTH session. If the POC gets tested during an overnight session, it does not count and remains "virgin" until it happens during a day session. 9.14 | |
| 4541.25 | Swing High (Overnight) | |
| 4536.75 | Poor HighA poor high is one which lacks excess and is the opposite of an excess high. A poor high will have less than two TPO's of excess at the top of a daily range with at least 2-3 columns of TPO's lining up to form a flat looking top. It indicates that there are short term or weak handed longs at that high of day area. We know this because every time prices rise to the top, they get sold quickly, thus forming the poor high. The poor high has two forward looking indications. The first is that prices should back away from the poor high as there are a number of longs trapped at poor location. The second is that if the next day or in some subsequent session, the poor high is revisited, then the odds are strong that it will break and move higher. This is called repair as it repairs the structur... | |
| 4526.25 | RTHRegular Trading Hours. In the /ES this means the price action from 9:30am EST to 4:15pm EST only. High | |
| 4523.50 | ONLOvernight Low. A term mostly used for the futures market as it trades almost around the clock. To be precise, in the /ES this would be the lowest price between 4:30pm EST and 9:30am EST the next day. / Settlement / POCPoint of Control, also known as the "fairest price to do business". It is the price level in the /ES where the greatest amount of volume in the prior RTH session traded. ShadowTrader measures the POC using volume but the traditional way is to mark off the widest point of the day's distribution where the most TPO's printed going across from left to right, indicating that that was the price where the most time was spent. It's important to pay attention to both the volume POC and the TPO POC. / 45 degree lineThe 45 degree line is an interesting market profile nuance. It occurs when a 45 degree line can be drawn from the lowest point of a distribution to its widest point (TPO POC). This is a sign that sellers have painted themselves into a corner near the lows of the session and creates potential for an upward reversal in the next session. As less and less time is spent the closer you get to the low of the session, sellers are essentially initiating shorts at less and less value. 45 degree line lows should be assumed to be secure until they are breached. The pattern is generally only noted in RTH sessions but they have shown to be relatively reliable signals in overnight sessions as well. The obvious question is always whether or not the 45 degree line can be drawn in from the high of the day t... | |
| Virgin Point of ControlAlso called “POC” for short. The level in the futures inside the value area where either the greatest amount of volume traded in the prior session, or the greatest amount of time was spent as measured by the number of TPO’s going across. Measured this way, the POC would be the widest part of any given market profile. While ShadowTrader calculates its value areas and points of control using volume exclusively, we are always very aware of where the TPO POC is and it’s relation to current prices or patterns in the profile. Both are very important. (VPOCVirgin Point of Control. This is a point of control level that has not yet been tested (traded through) during an RTH session. If the POC gets tested during an overnight session, it does not count and remains "virgin" until it happens during a day session.) | ||
| 09.14.2023 | 4554.75 | |
| 11.13.2023 | 4425.75 | |
| 11.09.2023 | 4362.00 | |
| 11.02.2023 | 4336.00 | |
| 10.24.2023 | 4270.50 | |
| 11.01.2023 | 4256.50 | |
| 10.31.2023 | 4211.75 | |
| 10.27.2023 | 4132.00 | |
| Today’s ESThe S&P 500 e-mini contract. In the broadcast we use this as our primary instrument to define market direction and effect short term trades when we have a bias in the market. This is the electronic contract that trades around the clock, as opposed to the pit traded contract. Sometimes the pit traded version is called the “big contract”. Futures contracts on are denoted by two letters and then a letter and a number to define their expiration month. The ES has four contract periods per year which expire in March, June, September, and December. These four months are denoted by the letters H, M, U, and Z. For example, if it was 2012, then the March contract would be called the /ESH2. Thinkorswim requires a forward slash before the letters. Certain trading platforms and charting packages ma... and NQThe Nasdaq 100 E-Mini futures. In the broadcast we only discuss this contract in the pre-market to get a feel for where the Nasdaq will open. Market ProfileA way of reading the market that recognizes either time spent or volume traded at a particular price level. A market profile can be either made up of “TPO’s” (time price opportunities), or volume. TPO’s measure how much time was spent at a particular price, while volume-based market profiles measure how much volume traded at a particular price. Generally, market profile is used in the trading of futures, especially the /ES. ShadowTrader utilizes volume based profiles. and Pivot Point Numbers | ||
| Value Area HighThe high end of the range of the value area. | 4523.75 | 15902.00 |
| Point of ControlAlso called “POC” for short. The level in the futures inside the value area where either the greatest amount of volume traded in the prior session, or the greatest amount of time was spent as measured by the number of TPO’s going across. Measured this way, the POC would be the widest part of any given market profile. While ShadowTrader calculates its value areas and points of control using volume exclusively, we are always very aware of where the TPO POC is and it’s relation to current prices or patterns in the profile. Both are very important. | 4523.25 | 15874.50 |
| Value Area LowThe low end of the range of the value area. | 4511.25 | 15846.00 |
| R3 | 4556.75 | 16041.00 |
| R2 | 4541.50 | 15974.50 |
| R1 | 4532.25 | 15931.00 |
| Pivot | 4517.00 | 15864.50 |
| S1 | 4507.75 | 15821.00 |
| S2 | 4492.50 | 15754.50 |
| S3 | 4483.25 | 15711.00 |


