
- True gapThere is a lot of discussion as to what constitutes a gap. Is it measured to the prior day's close, or to the prior day's high or low? Here at ShadowTrader, we believe that it is always and only to a prior day's high or low, thus creating a true gap or space on the chart between one day and the next. Thus a true gap is one that has price opening completely outside of the prior day's range (either above the high or below the low) and anything else is just a gap that has far less import. As a gap is a "reordering of thinking", only a true gap really changes the tone and creates opportunity to trade earlier (near the open) rather than later. More lower on balanced overnight inventoryA way of measuring overnight activity in the futures market by just noting how much of the overnight activity happens to fall above the prior day's settlement value (4:15pm EST close) and how much falls below. If more activity is above the settlement, then overnight inventory is said to be net long. If more is below, then it is said to be net short. If all of the overnight activity is above the settlement, then it is said to be 100% net long. If all of the activity is below the settlement then it is said to be 100% net short. The overnight inventory situation matters most and has the most impact on early trade when it is skewed 100% in either direction because when the imbalance is very large like that then the odds of an early correction increase greatly. This is due to the fact that most...
- Sellers remain in firm control
- /ES showing a lot of relative weakness being below the 8.18 low whereas /NQ is still not
- Gap rulesGuidelines to follow on any day that the futures open outside of the prior day's RTH range. Only opening outside of range is a true gap and puts gap rules in play. 1. Go with all gaps that don't fill right away. This means that if early trade doesn't start to correct the imbalance, then prices will probably move in the direction of the gap. 2. Larger gaps can often fail to fill on the first day or may fill only partially. 3. If the gap fills (meaning the prior day's RTH high is touched on a gap up or the prior day's RTH low is touched on a gap down) and value cannot get to at least overlapping, then the odds of a late day rally (on a gap up) or late day selloff (on a gap down) increase. 4. Gaps of larger than $20 in the /ES are difficult to trade and should be avoided early in the day as t... More are in play
- VPOCs are starting to stack above us, indicating growing downside momentum
| Pre Market Indications | ||
| Opening In/Out Balance | out of balance | |
| Overnight InventoryA way of measuring overnight activity in the futures market by just noting how much of the overnight activity happens to fall above the prior day's settlement value (4:15pm EST close) and how much falls below. If more activity is above the settlement, then overnight inventory is said to be net long. If more is below, then it is said to be net short. If all of the overnight activity is above the settlement, then it is said to be 100% net long. If all of the activity is below the settlement then it is said to be 100% net short. The overnight inventory situation matters most and has the most impact on early trade when it is skewed 100% in either direction because when the imbalance is very large like that then the odds of an early correction increase greatly. This is due to the fact that most... | balanced | |
| Current Price/Overnight Range | lower third | |
| Shock and AweA term Peter uses to describe what overnight futures traders may be feeling when faced with an open that is wildly divergent from what they expected. Large gaps in either direction that are opening well outside of range are examples of this. The approach is that when the market opens in such a manner, there is often opportunity to trade earlier rather than later because of the large contingent of traders who will be forced to reverse their positions quickly. | yes | |
| Potential for Early Trade | yes | |
| Short Term Bias | bearish | |
Scenarios
- Even though overnight inventoryA way of measuring overnight activity in the futures market by just noting how much of the overnight activity happens to fall above the prior day's settlement value (4:15pm EST close) and how much falls below. If more activity is above the settlement, then overnight inventory is said to be net long. If more is below, then it is said to be net short. If all of the overnight activity is above the settlement, then it is said to be 100% net long. If all of the activity is below the settlement then it is said to be 100% net short. The overnight inventory situation matters most and has the most impact on early trade when it is skewed 100% in either direction because when the imbalance is very large like that then the odds of an early correction increase greatly. This is due to the fact that most... is very balanced, potential for early fadeWhen a stock moves opposite the direction of its gap on an intraday basis is still present although lessened a bit. First scenario on any true gapThere is a lot of discussion as to what constitutes a gap. Is it measured to the prior day's close, or to the prior day's high or low? Here at ShadowTrader, we believe that it is always and only to a prior day's high or low, thus creating a true gap or space on the chart between one day and the next. Thus a true gap is one that has price opening completely outside of the prior day's range (either above the high or below the low) and anything else is just a gap that has far less import. As a gap is a "reordering of thinking", only a true gap really changes the tone and creates opportunity to trade earlier (near the open) rather than later. More lower is to see if we fadeWhen a stock moves opposite the direction of its gap on an intraday basis at all. Note signposts above as discussed in video.
- /NQ moving below the 8.18 low and finding acceptanceWhen the market profile begins to build out or develop in a certain area, it is said that the market is accepting those prices. This can be measured either in time spent or amount of volume that is transacted. It is generally understood that ShadowTrader defines acceptance as more of a time dynamic than a volume one. A good rule of thumb is to look for at least two TPO periods to print in the accepted area. The acceptance confirms that a significant amount of market participants are transacting at those levels. Acceptance is the opposite of rejection. More there indicates stronger selling than if this level is not taken out. Always keep in mind how connected these two markets (/ES and /NQ) are.
- Settlement is a key level today because that is where “screens go green” around the world and in a bearish tape that has potential to induce short covering.
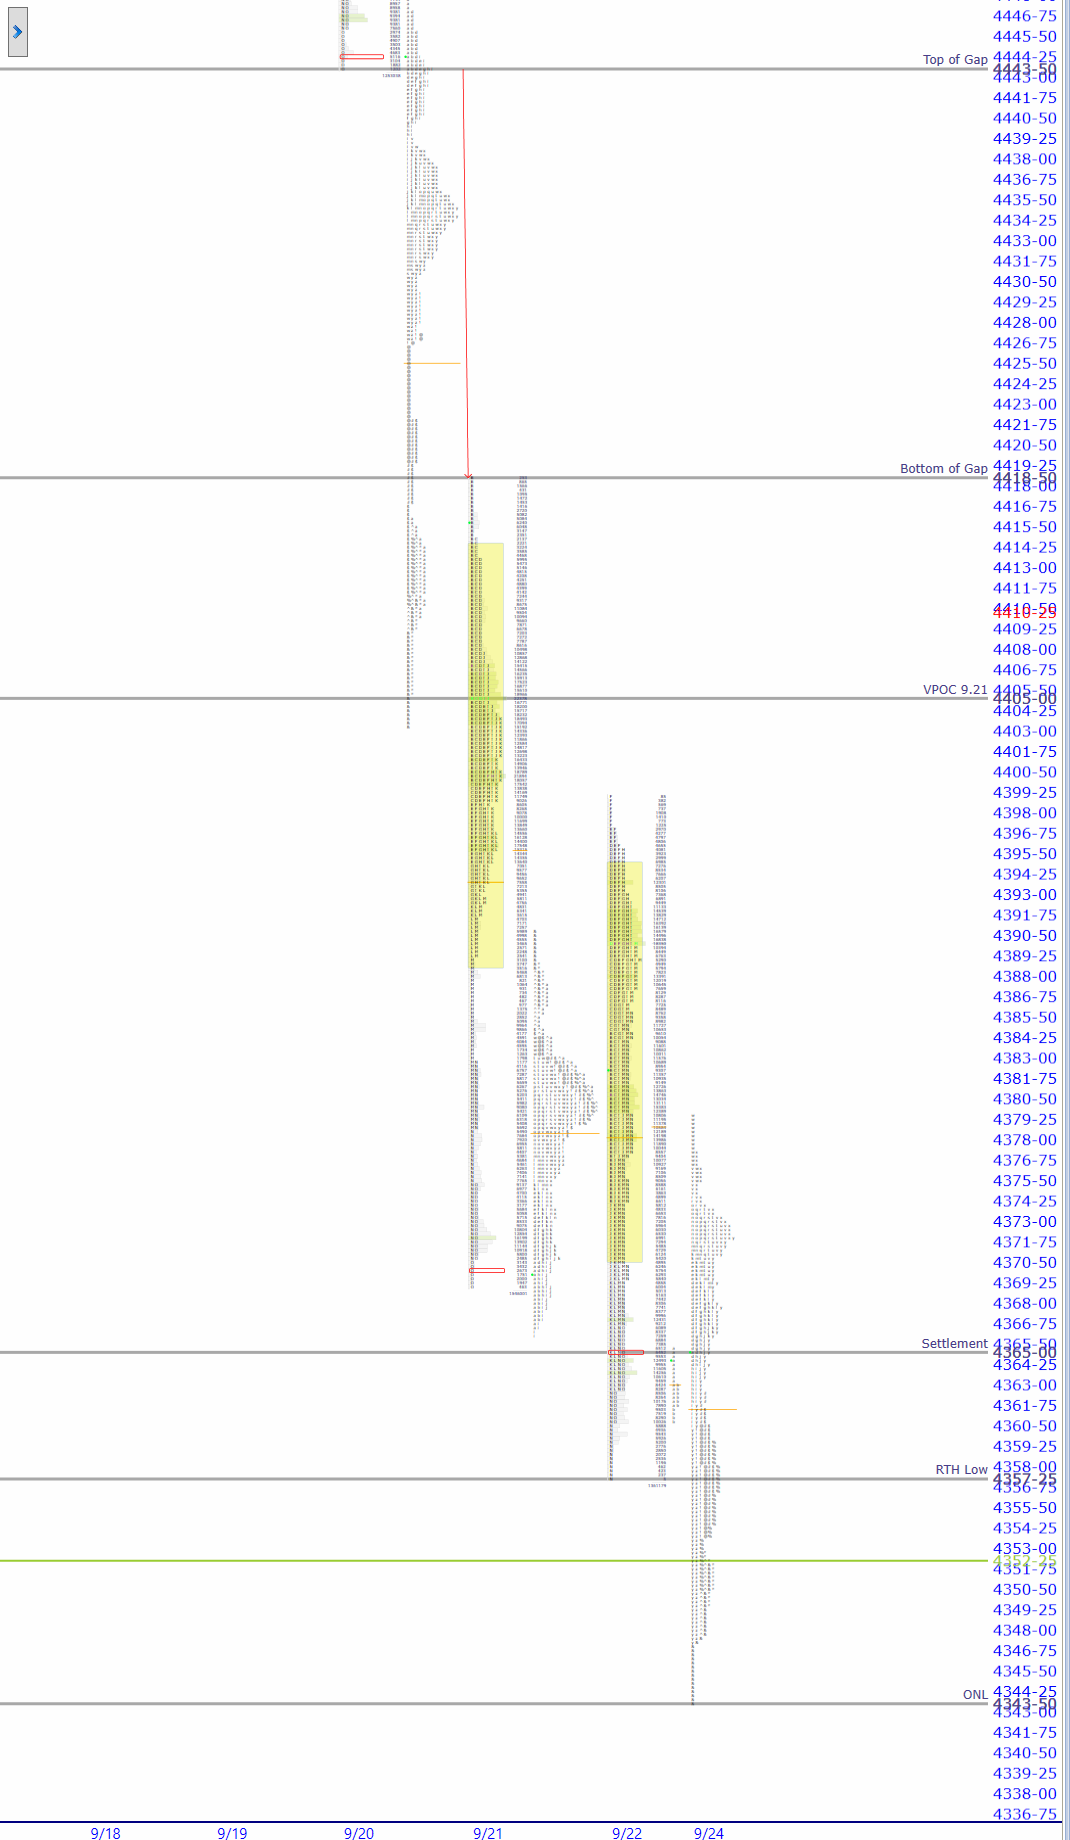
| Today’s Market ProfileA way of reading the market that recognizes either time spent or volume traded at a particular price level. A market profile can be either made up of “TPO’s” (time price opportunities), or volume. TPO’s measure how much time was spent at a particular price, while volume-based market profiles measure how much volume traded at a particular price. Generally, market profile is used in the trading of futures, especially the /ES. ShadowTrader utilizes volume based profiles. Chart |
The chart provided is from WindoTrader. CLICK HERE to learn more about the ShadowTrader discount. Interpret the chart above with the Market Profile Key.
| Key Levels for Today | ||
| 4365.00 | Settlement | |
| 4357.25 | RTHRegular Trading Hours. In the /ES this means the price action from 9:30am EST to 4:15pm EST only. Low | |
| 4343.50 | ONLOvernight Low. A term mostly used for the futures market as it trades almost around the clock. To be precise, in the /ES this would be the lowest price between 4:30pm EST and 9:30am EST the next day. | |
| Virgin Point of ControlAlso called “POC” for short. The level in the futures inside the value area where either the greatest amount of volume traded in the prior session, or the greatest amount of time was spent as measured by the number of TPO’s going across. Measured this way, the POC would be the widest part of any given market profile. While ShadowTrader calculates its value areas and points of control using volume exclusively, we are always very aware of where the TPO POC is and it’s relation to current prices or patterns in the profile. Both are very important. (VPOCVirgin Point of Control. This is a point of control level that has not yet been tested (traded through) during an RTH session. If the POC gets tested during an overnight session, it does not count and remains "virgin" until it happens during a day session.) | ||
| 09.14.2023 | 4554.75 | |
| 09.20.2023 | 4499.25 | |
| 09.21.2023 | 4405.00 | |
| Today’s ESThe S&P 500 e-mini contract. In the broadcast we use this as our primary instrument to define market direction and effect short term trades when we have a bias in the market. This is the electronic contract that trades around the clock, as opposed to the pit traded contract. Sometimes the pit traded version is called the “big contract”. Futures contracts on are denoted by two letters and then a letter and a number to define their expiration month. The ES has four contract periods per year which expire in March, June, September, and December. These four months are denoted by the letters H, M, U, and Z. For example, if it was 2012, then the March contract would be called the /ESH2. Thinkorswim requires a forward slash before the letters. Certain trading platforms and charting packages ma... and NQThe Nasdaq 100 E-Mini futures. In the broadcast we only discuss this contract in the pre-market to get a feel for where the Nasdaq will open. Market ProfileA way of reading the market that recognizes either time spent or volume traded at a particular price level. A market profile can be either made up of “TPO’s” (time price opportunities), or volume. TPO’s measure how much time was spent at a particular price, while volume-based market profiles measure how much volume traded at a particular price. Generally, market profile is used in the trading of futures, especially the /ES. ShadowTrader utilizes volume based profiles. and Pivot Point Numbers | ||
| Value Area HighThe high end of the range of the value area. | 4395.00 | 14981.00 |
| Point of ControlAlso called “POC” for short. The level in the futures inside the value area where either the greatest amount of volume traded in the prior session, or the greatest amount of time was spent as measured by the number of TPO’s going across. Measured this way, the POC would be the widest part of any given market profile. While ShadowTrader calculates its value areas and points of control using volume exclusively, we are always very aware of where the TPO POC is and it’s relation to current prices or patterns in the profile. Both are very important. | 4390.00 | 14921.00 |
| Value Area LowThe low end of the range of the value area. | 4370.50 | 14857.00 |
| R3 | 4429.50 | 15155.50 |
| R2 | 4414.25 | 15091.50 |
| R1 | 4387.75 | 14980.50 |
| Pivot | 4372.50 | 14916.50 |
| S1 | 4346.00 | 14805.50 |
| S2 | 4330.75 | 14741.50 |
| S3 | 4304.25 | 14630.50 |


