The Market ProfileA way of reading the market that recognizes either time spent or volume traded at a particular price level. A market profile can be either made up of “TPO’s” (time price opportunities), or volume. TPO’s measure how much time was spent at a particular price, while volume-based market profiles measure how much volume traded at a particular price. Generally, market profile is used in the trading of futures, especially the /ES. ShadowTrader utilizes volume based profiles. valueThis value has nothing to do with valuation. It denotes prices that are "fair". Fair in this sense means a price that is common to a lot of participants. An item that you buy once per week in a store at a price that doesn't fluctuate has a "fair price". You can express this by a formula Value = Price + Time or Value = Price + Volume Either of the above are valid ways of expressing value. In the first equation, value is defined by price staying the same for a long period of time. In the futures market, this would be an area that is revisted a lot during a particular session or multiple sessions. The point of control is the price level where the most amount of time was spent during an RTH session. James Dalton refers to this level as "the fairest price to do business". Using vo... More areas and ShadowTrader Pivots for /ESU22 and /NQU22 Futures are posted free every morning in the ShadowTrader Swing Trader newsletter.
WindoTrader 702-800-4628 Speak with Terry about the ShadowTrader discount or CLICK HERE to learn more.
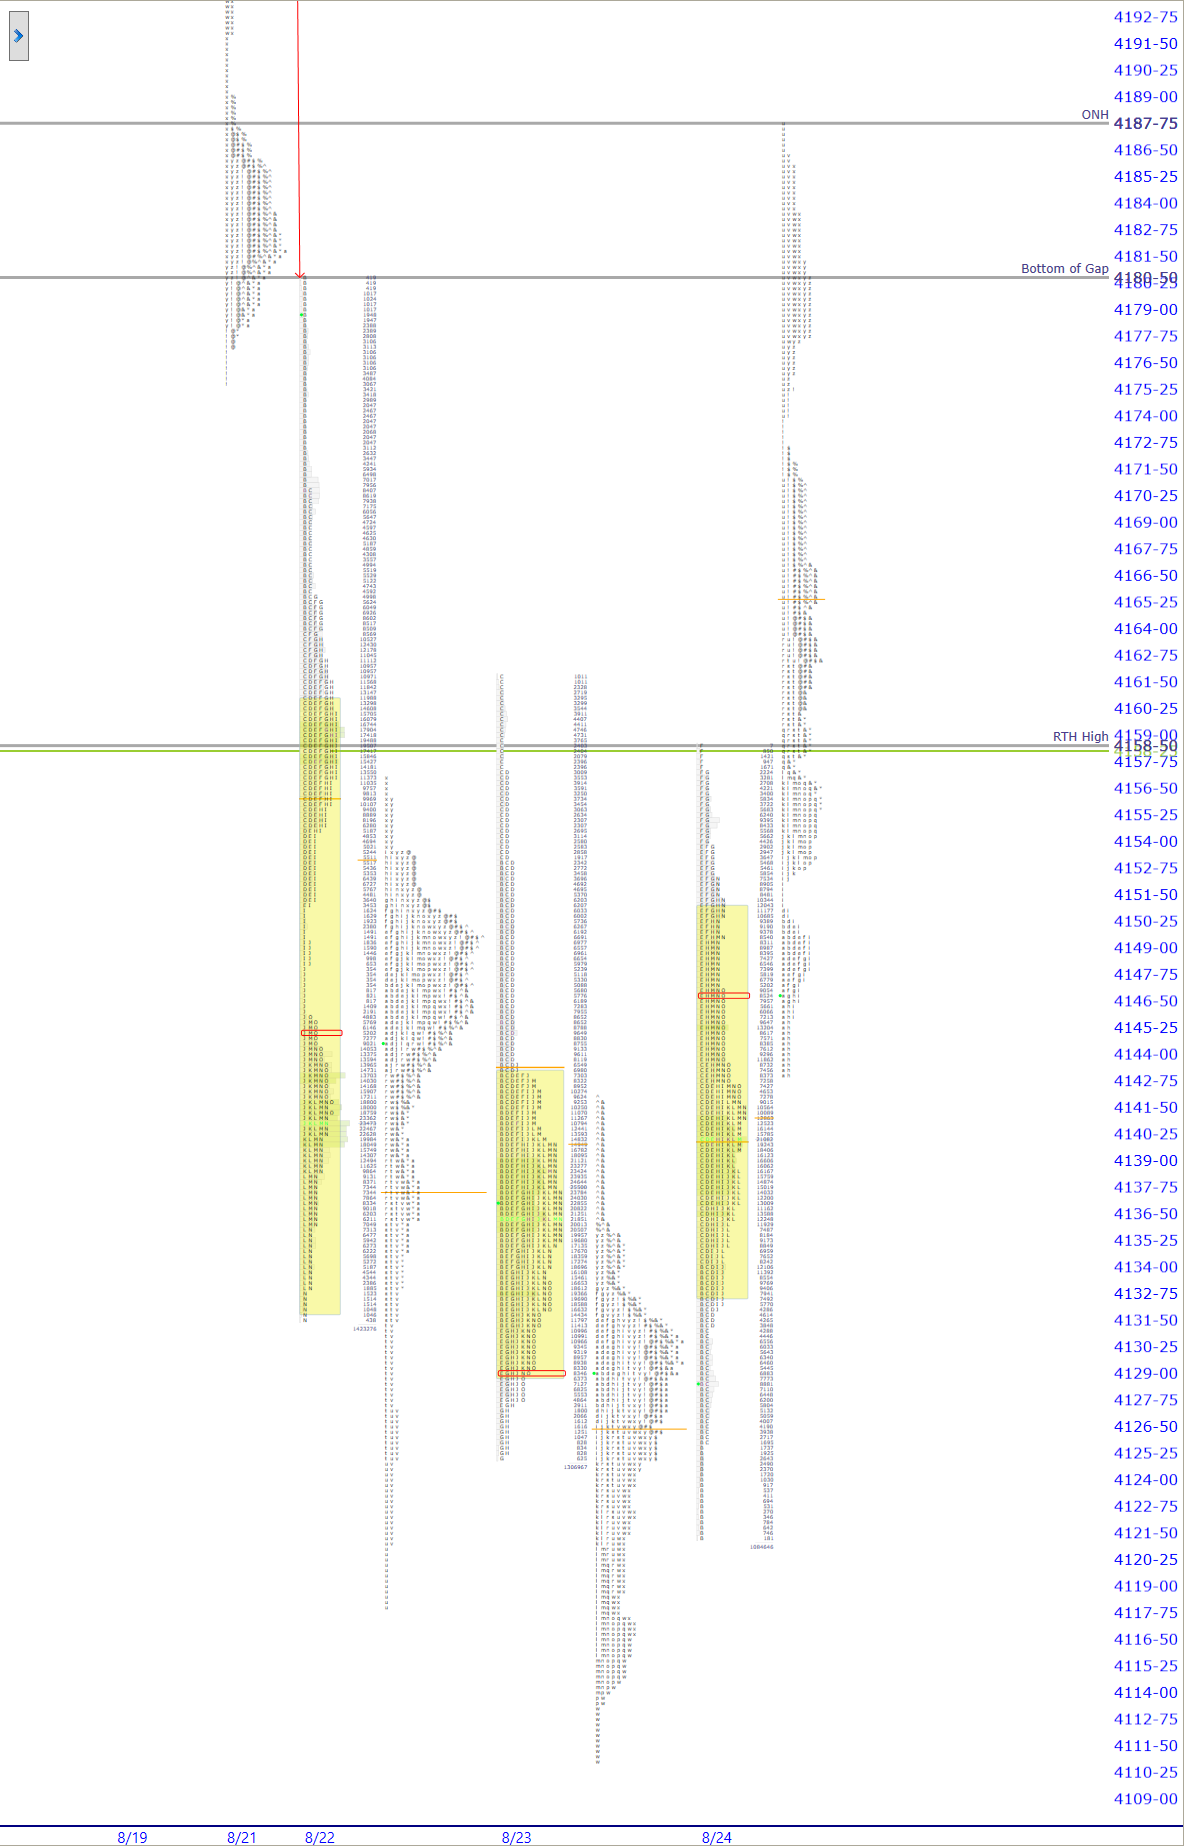
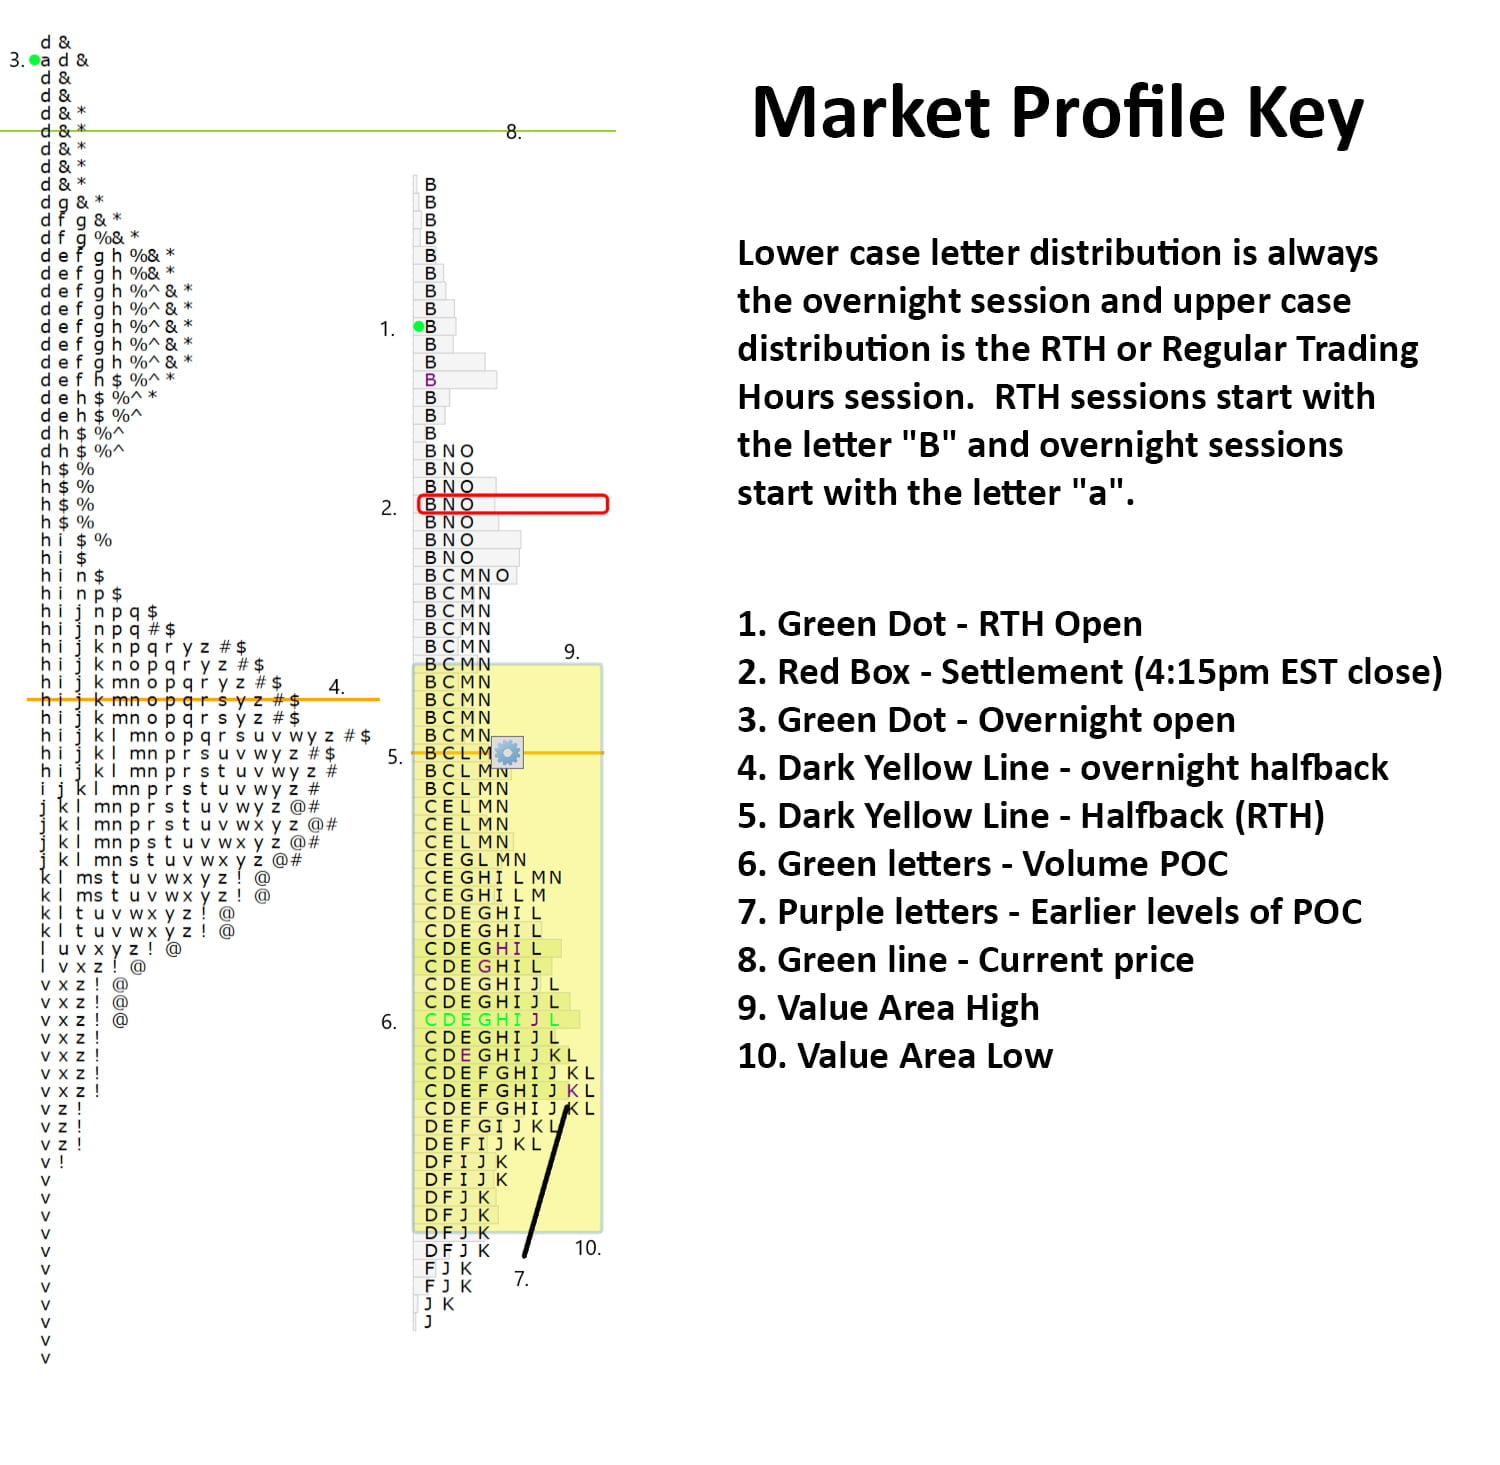
Click HERE for a market profile key that will help you interpret the chart above.
Pre market indications
| Opening In/Out Balance | out of balance |
|---|---|
| Overnight InventoryA way of measuring overnight activity in the futures market by just noting how much of the overnight activity happens to fall above the prior day's settlement value (4:15pm EST close) and how much falls below. If more activity is above the settlement, then overnight inventory is said to be net long. If more is below, then it is said to be net short. If all of the overnight activity is above the settlement, then it is said to be 100% net long. If all of the activity is below the settlement then it is said to be 100% net short. The overnight inventory situation matters most and has the most impact on early trade when it is skewed 100% in either direction because when the imbalance is very large like that then the odds of an early correction increase greatly. This is due to the fact that most... | net long |
| Current Price/Overnight Range | middle third |
| Shock and AweA term Peter uses to describe what overnight futures traders may be feeling when faced with an open that is wildly divergent from what they expected. Large gaps in either direction that are opening well outside of range are examples of this. The approach is that when the market opens in such a manner, there is often opportunity to trade earlier rather than later because of the large contingent of traders who will be forced to reverse their positions quickly. | yes |
| Potential for Early Trade | yes |
| Short Term Bias | uptrend broken, prices below 20sma daily |
Key Levels for Today
| 4187.75 | ONHOvernight High. A term mostly used in describing the futures market which has an overnight session and trades almost around the clock. To be precise, in the /ES this is the high made between 4:30pm EST and 9:30am EST the next day. |
|---|---|
| 4180.50 | Bottom of Gap |
| 4158.50 | RTHRegular Trading Hours. In the /ES this means the price action from 9:30am EST to 4:15pm EST only. High |
Ongoing Narrative / Commentary
Large overnight gap has faded to no gap at all as prices are currently marking inside of yesterday’s RTHRegular Trading Hours. In the /ES this means the price action from 9:30am EST to 4:15pm EST only. range. Opening above that RTHRegular Trading Hours. In the /ES this means the price action from 9:30am EST to 4:15pm EST only. High would be a true gapThere is a lot of discussion as to what constitutes a gap. Is it measured to the prior day's close, or to the prior day's high or low? Here at ShadowTrader, we believe that it is always and only to a prior day's high or low, thus creating a true gap or space on the chart between one day and the next. Thus a true gap is one that has price opening completely outside of the prior day's range (either above the high or below the low) and anything else is just a gap that has far less import. As a gap is a "reordering of thinking", only a true gap really changes the tone and creates opportunity to trade earlier (near the open) rather than later. More higher, opening within range (even if above the settlement) would not.
Market slightly on edge ahead of Friday’s Jackson Hole speech by Fed Chair Powell. That is happening at 10am ET tomorrow.
The last three RTHRegular Trading Hours. In the /ES this means the price action from 9:30am EST to 4:15pm EST only. sessions have had unchanged valueThis value has nothing to do with valuation. It denotes prices that are "fair". Fair in this sense means a price that is common to a lot of participants. An item that you buy once per week in a store at a price that doesn't fluctuate has a "fair price". You can express this by a formula Value = Price + Time or Value = Price + Volume Either of the above are valid ways of expressing value. In the first equation, value is defined by price staying the same for a long period of time. In the futures market, this would be an area that is revisted a lot during a particular session or multiple sessions. The point of control is the price level where the most amount of time was spent during an RTH session. James Dalton refers to this level as "the fairest price to do business". Using vo... More and I am seeing them as a balance area. We are currently well off of the ONHOvernight High. A term mostly used in describing the futures market which has an overnight session and trades almost around the clock. To be precise, in the /ES this is the high made between 4:30pm EST and 9:30am EST the next day. and that could spell some overhead supplyWhen a stock or index suffers a down move, it is said that the area to the left of current prices which is higher is an area of “overhead supply”. This is because we know that not all individuals on the way down were sellers. At all levels are buyers and sellers who are net long or short. As stocks move up back towards resistant areas we say that they have overhead supply because we know that bulls will be waiting to “get their money back” as the stock rises back to levels that they purchased at. More in the early part of today’s session. Remember that there has been no real up trend since the larger move down, but more of a sideways consolidation.
Unless buyers get it in gear soon and with some gusto, I would be leaning towards the downtrend resuming.
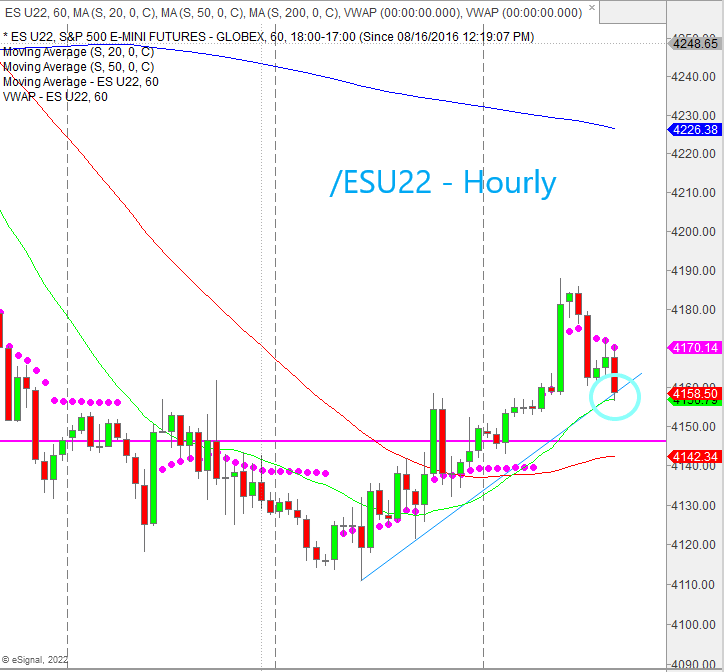
Yesterday’s chart of the day was an hourly /ES and I’m going with the same thing today as there is an important trendline from the recent swing low that we are sitting right on currently. Any price action below that line essentially stops the recent uptrend and we would officially be going back down again. Holding above it is more bullish.
VPOC’s
- 08.16 4308.25
- 08.18 4278.00
- 08.19 4230.75
- 08.02 4094.25
- 07.28 4073.50
- 07.27 3975.00
- 07.26 3924.25
- 07.13 3808.00
- 07.14 3794.25
- 06.17 3675.50
Scenarios
- Being so far off of the ONHOvernight High. A term mostly used in describing the futures market which has an overnight session and trades almost around the clock. To be precise, in the /ES this is the high made between 4:30pm EST and 9:30am EST the next day. and coming into range creates overhead supplyWhen a stock or index suffers a down move, it is said that the area to the left of current prices which is higher is an area of “overhead supply”. This is because we know that not all individuals on the way down were sellers. At all levels are buyers and sellers who are net long or short. As stocks move up back towards resistant areas we say that they have overhead supply because we know that bulls will be waiting to “get their money back” as the stock rises back to levels that they purchased at. More which has potential to be bearish at the open. Watch the trendline (hourly chart above) closely. Any early weakness should target the settlement.
- Finding acceptanceWhen the market profile begins to build out or develop in a certain area, it is said that the market is accepting those prices. This can be measured either in time spent or amount of volume that is transacted. It is generally understood that ShadowTrader defines acceptance as more of a time dynamic than a volume one. A good rule of thumb is to look for at least two TPO periods to print in the accepted area. The acceptance confirms that a significant amount of market participants are transacting at those levels. Acceptance is the opposite of rejection. More within yesterday’s range would keep the market in balance and increase odds of the downtrend resuming. Holding outside of the recent balance would be the opposite.
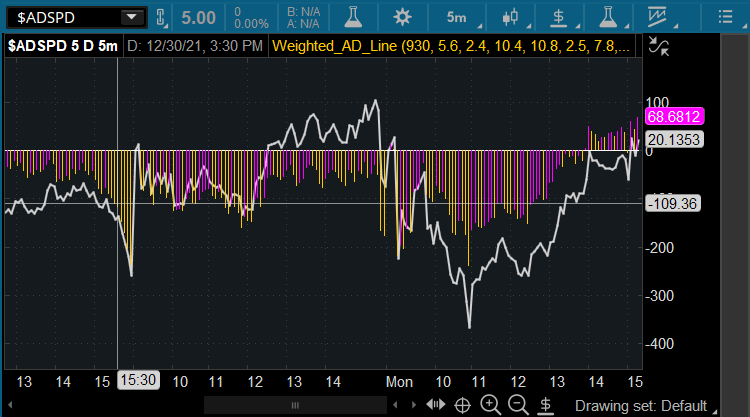
Weighted S&P A/D Line Indicator
This script plots both an unweighted and a weighted A/D line using the 11 S&P sectors and their respective weights. This gives the trader a huge edge in discerning the strength of moves and also knowing when there is positive or negative divergence in heavier versus lighter weighted sectors as the day unfolds.
GET YOURS NOW

