The Market ProfileA way of reading the market that recognizes either time spent or volume traded at a particular price level. A market profile can be either made up of “TPO’s” (time price opportunities), or volume. TPO’s measure how much time was spent at a particular price, while volume-based market profiles measure how much volume traded at a particular price. Generally, market profile is used in the trading of futures, especially the /ES. ShadowTrader utilizes volume based profiles. valueThis value has nothing to do with valuation. It denotes prices that are "fair". Fair in this sense means a price that is common to a lot of participants. An item that you buy once per week in a store at a price that doesn't fluctuate has a "fair price". You can express this by a formula Value = Price + Time or Value = Price + Volume Either of the above are valid ways of expressing value. In the first equation, value is defined by price staying the same for a long period of time. In the futures market, this would be an area that is revisted a lot during a particular session or multiple sessions. The point of control is the price level where the most amount of time was spent during an RTH session. James Dalton refers to this level as "the fairest price to do business". Using vo... More areas and ShadowTrader Pivots for /ESH22 and /NQH22 Futures are posted free every morning in the ShadowTrader Swing Trader newsletter.
WindoTrader 702-800-4628 Speak with Terry about the ShadowTrader discount or CLICK HERE to learn more.
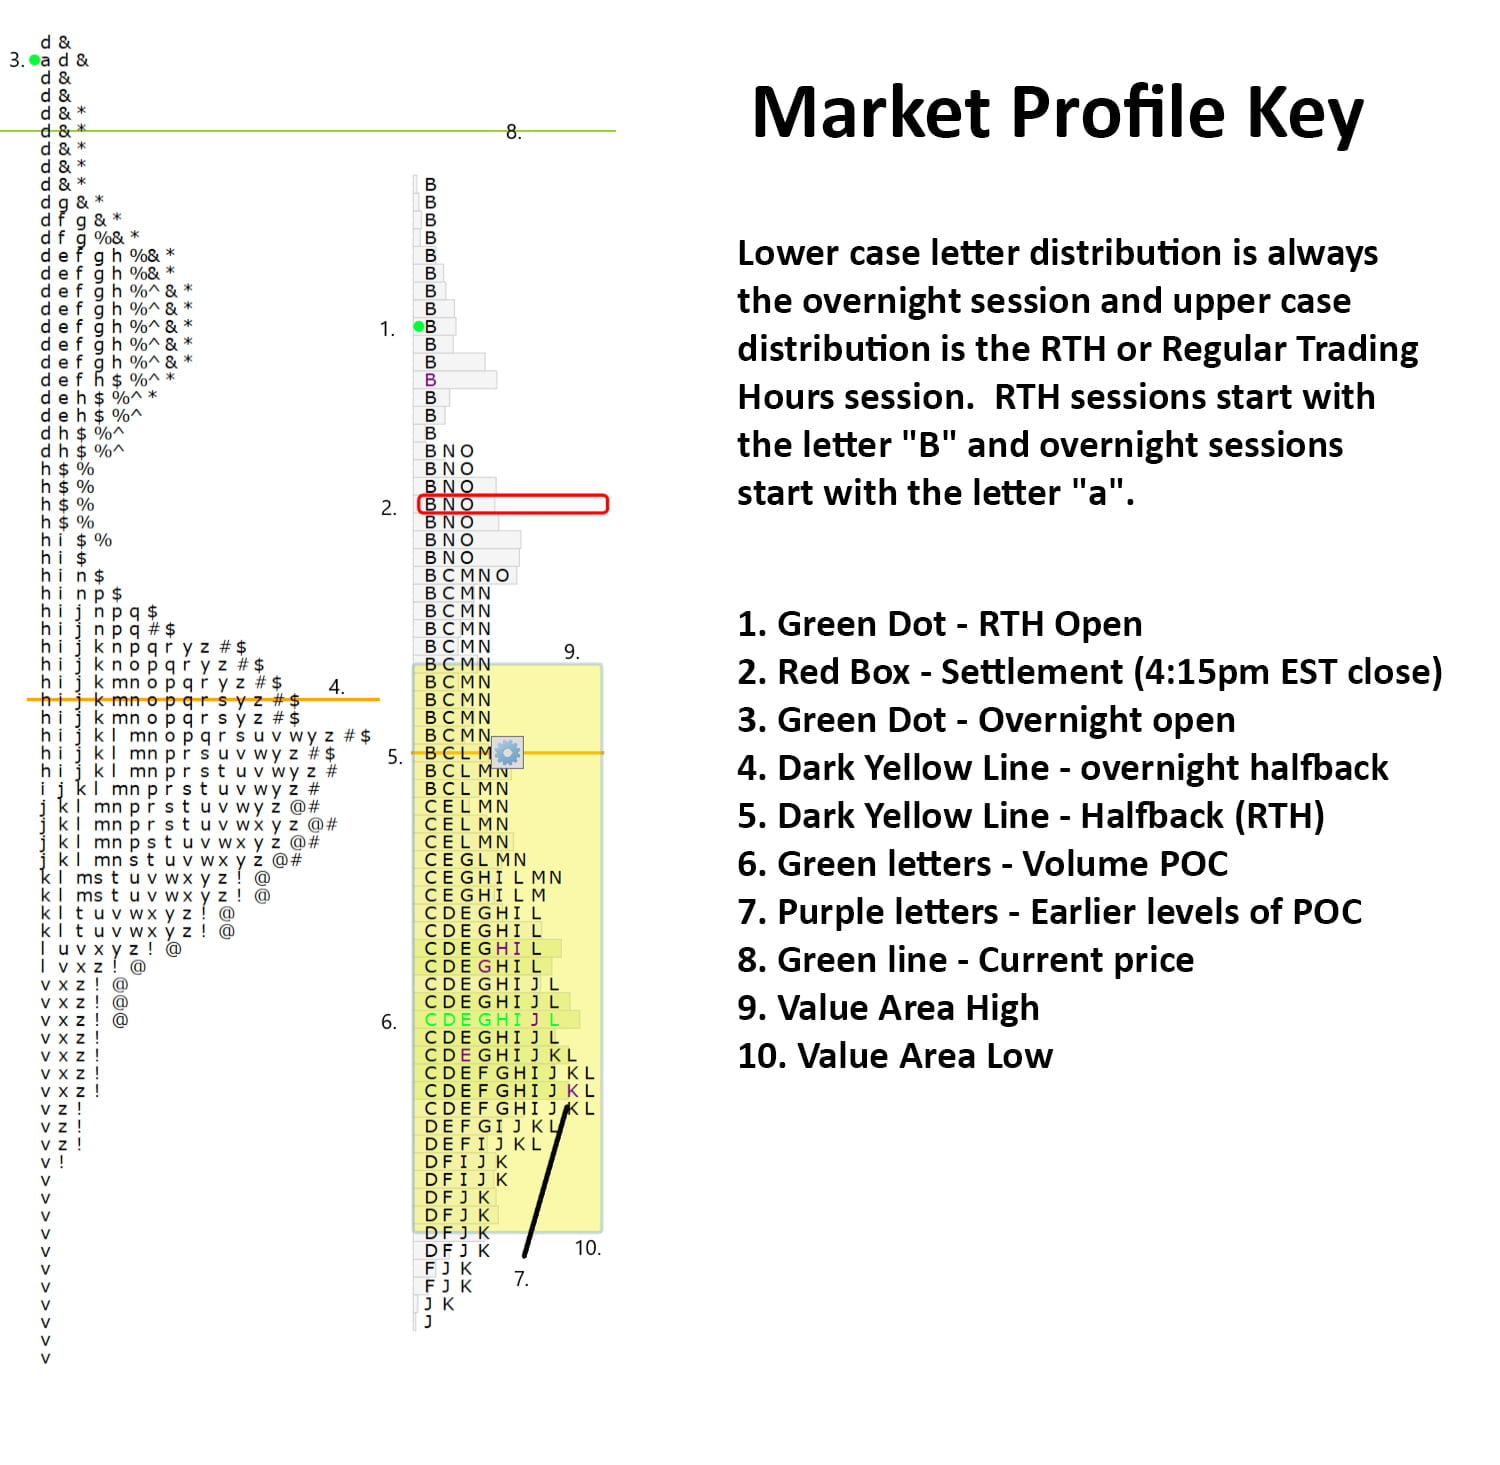
Click HERE for a market profile key that will help you interpret the chart above.
Pre market indications
| Opening In/Out Balance | out of balance |
|---|---|
| Overnight InventoryA way of measuring overnight activity in the futures market by just noting how much of the overnight activity happens to fall above the prior day's settlement value (4:15pm EST close) and how much falls below. If more activity is above the settlement, then overnight inventory is said to be net long. If more is below, then it is said to be net short. If all of the overnight activity is above the settlement, then it is said to be 100% net long. If all of the activity is below the settlement then it is said to be 100% net short. The overnight inventory situation matters most and has the most impact on early trade when it is skewed 100% in either direction because when the imbalance is very large like that then the odds of an early correction increase greatly. This is due to the fact that most... | balanced |
| Current Price/Overnight Range | upper third |
| Shock and AweA term Peter uses to describe what overnight futures traders may be feeling when faced with an open that is wildly divergent from what they expected. Large gaps in either direction that are opening well outside of range are examples of this. The approach is that when the market opens in such a manner, there is often opportunity to trade earlier rather than later because of the large contingent of traders who will be forced to reverse their positions quickly. | yes |
| Potential for Early Trade | yes |
| Short Term Bias | potential reversal of trend |
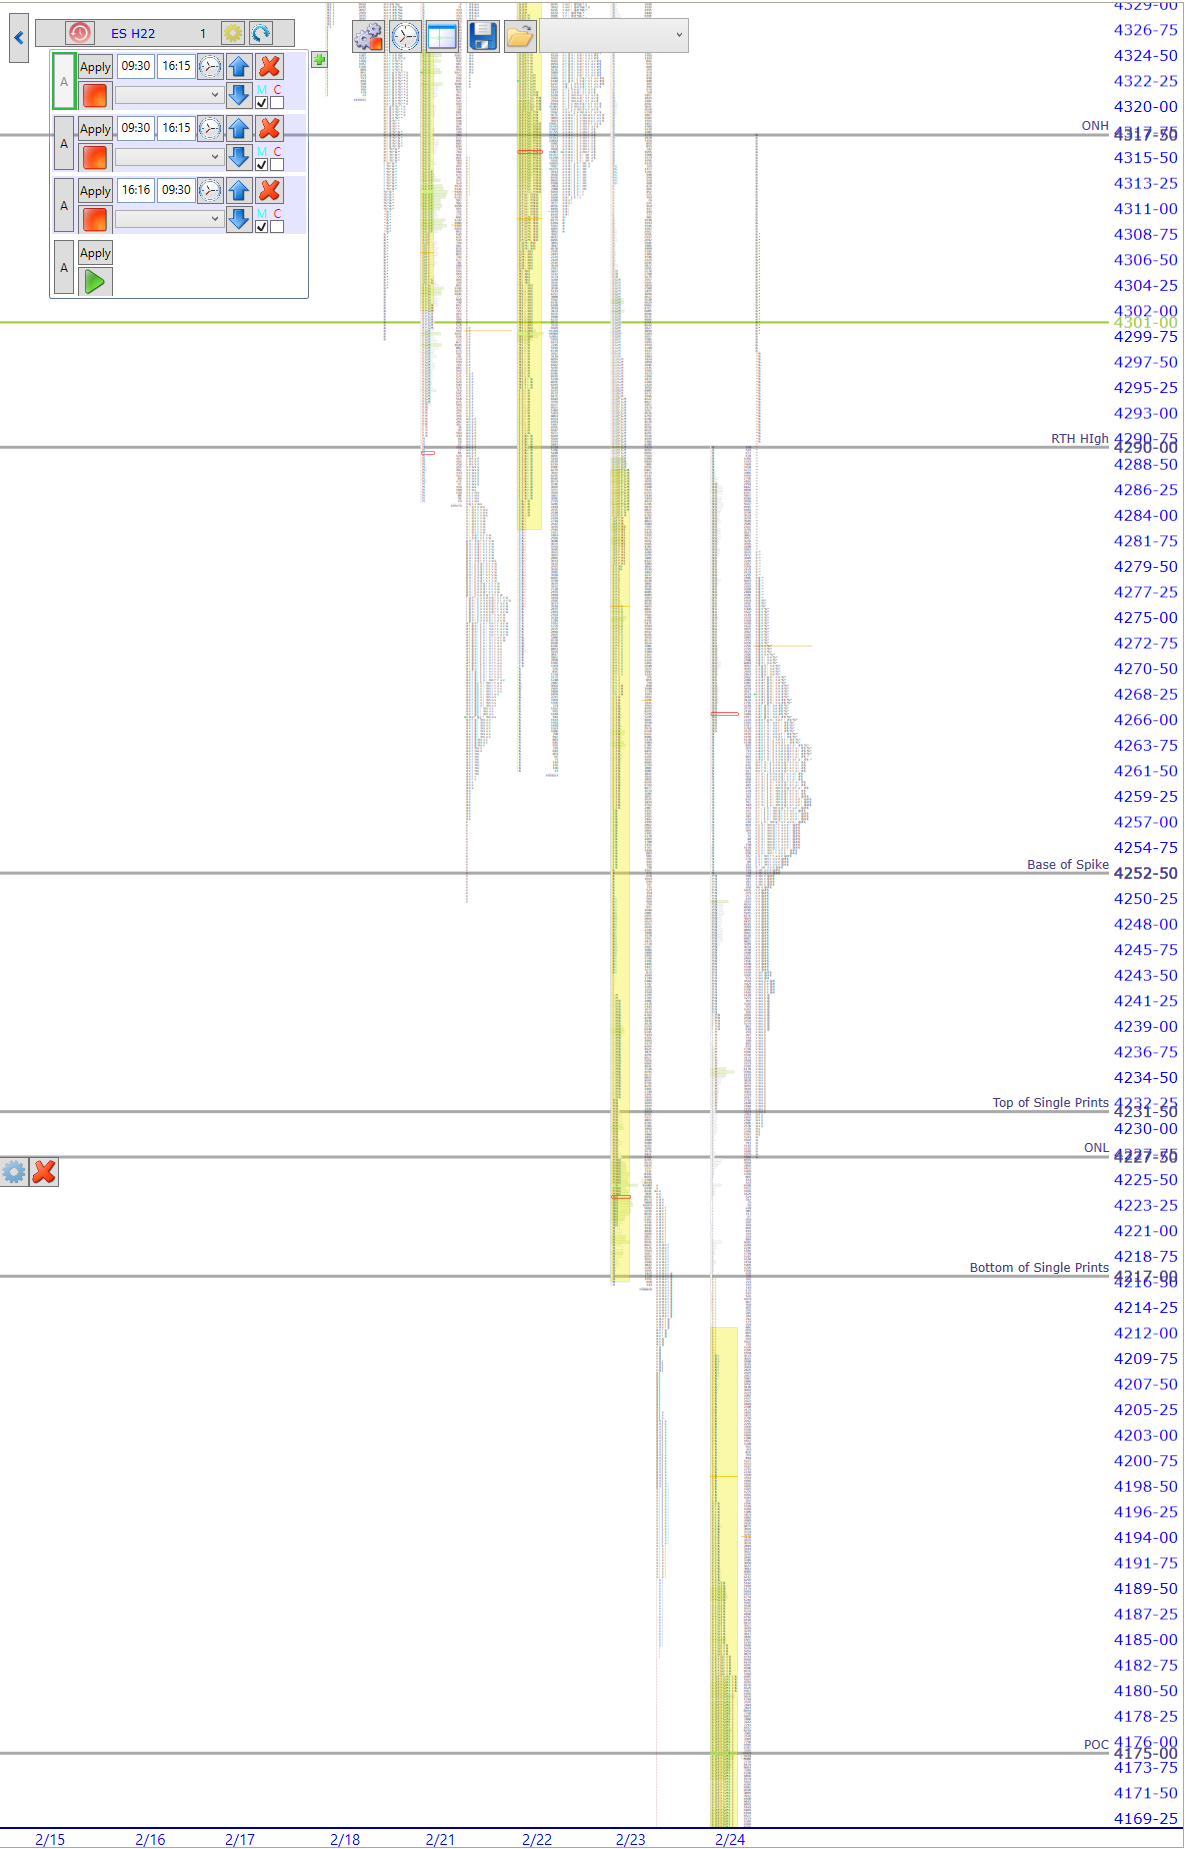
Key Levels for Today
| 4370.00 | Secondary down trend line resistance |
|---|---|
| 4317.50 | ONHOvernight High. A term mostly used in describing the futures market which has an overnight session and trades almost around the clock. To be precise, in the /ES this is the high made between 4:30pm EST and 9:30am EST the next day. |
| 4290.00 | RTHRegular Trading Hours. In the /ES this means the price action from 9:30am EST to 4:15pm EST only. High / Top of SpikeA set of single prints that are created in the last 30 minute session of the day which form at the top or bottom of a range. |
| 4252.50 | Base of SpikeA set of single prints that are created in the last 30 minute session of the day which form at the top or bottom of a range. |
Ongoing Narrative / Commentary
Sellers seem to be on the run now as the large gap down yesterday brought in about zero new sellers and the short covering went from opening bell to close. That close was at the top of the range and culminated in a spikeA set of single prints that are created in the last 30 minute session of the day which form at the top or bottom of a range. which is putting spike rulesA framework for analyzing a spike on the next trading day after it is formed.
Because the spike forms late in the day, it is impossible to gauge whether or not the higher or lower prices that have run quickly away from value will be deemed fair later. Thus we employ the spike rules in the next session.
Everything below is assuming a spike at the TOP of a daily range (reverse for a spike at the BOTTOM of a range)
-If prices open above the spike, that is considered bullish and tells us that prices didn't auction high enough in the spike to attract sellers and cut off buying activity. Monitor to see if there is acceptance above the spike.
-Prices opening within the spike confirm the higher prices of the spike. This tells us that the prices are fair enough for two sided... in play today. Gap rulesGuidelines to follow on any day that the futures open outside of the prior day's RTH range. Only opening outside of range is a true gap and puts gap rules in play. 1. Go with all gaps that don't fill right away. This means that if early trade doesn't start to correct the imbalance, then prices will probably move in the direction of the gap. 2. Larger gaps can often fail to fill on the first day or may fill only partially. 3. If the gap fills (meaning the prior day's RTH high is touched on a gap up or the prior day's RTH low is touched on a gap down) and value cannot get to at least overlapping, then the odds of a late day rally (on a gap up) or late day selloff (on a gap down) increase. 4. Gaps of larger than $20 in the /ES are difficult to trade and should be avoided early in the day as t... More are also in play as we have a true gapThere is a lot of discussion as to what constitutes a gap. Is it measured to the prior day's close, or to the prior day's high or low? Here at ShadowTrader, we believe that it is always and only to a prior day's high or low, thus creating a true gap or space on the chart between one day and the next. Thus a true gap is one that has price opening completely outside of the prior day's range (either above the high or below the low) and anything else is just a gap that has far less import. As a gap is a "reordering of thinking", only a true gap really changes the tone and creates opportunity to trade earlier (near the open) rather than later. More higher currently.
In addition to the spikeA set of single prints that are created in the last 30 minute session of the day which form at the top or bottom of a range., there was other poor structure within the profile (single printsAny section of the market profile distribution that is only one TPO wide. Single prints are a sign of emotional buying or selling as very little time was spent at those levels and thus there is no value there. The endpoints of single print sections are considered to be potential support or resistance points.) but this is normal on day one of a reversal when emotions run high and traders are forced to cover.
In yesterday’s weekly private webinar that Scott and I hold for options advisory members, I discussed that traders should pay attention to where the overnight activity comes down to in relation to the spikeA set of single prints that are created in the last 30 minute session of the day which form at the top or bottom of a range. and thin structure. If you look closely at the marketIf ShadowTrader is initiating a position “at the market” it simply means that limit orders are not being used and the position is being entered with no regard to price. This is used much more often on more liquid Nasdaq issues.<market profileA way of reading the market that recognizes either time spent or volume traded at a particular price level. A market profile can be either made up of “TPO’s” (time price opportunities), or volume. TPO’s measure how much time was spent at a particular price, while volume-based market profiles measure how much volume traded at a particular price. Generally, market profile is used in the trading of futures, especially the /ES. ShadowTrader utilizes volume based profiles. graphic above, you’ll note that we did retrace quite a bit, however, not fully into the single printsAny section of the market profile distribution that is only one TPO wide. Single prints are a sign of emotional buying or selling as very little time was spent at those levels and thus there is no value there. The endpoints of single print sections are considered to be potential support or resistance points., nor into the value areaA range where approximately 70% of the prior days volume traded. The range is derived from one standard deviation on either side of the mean which is roughly 70%. See: Market Profile. Consider that short term bullish. A rally can only get under way when the first higher low has been put in. Watch the ONLOvernight Low. A term mostly used for the futures market as it trades almost around the clock. To be precise, in the /ES this would be the lowest price between 4:30pm EST and 9:30am EST the next day. closely today to see if that is indeed a higher low that is secure.
In the Key Levels above, I’ve listed a technical level that I believe is important. Since we are discussing the potential for reversal such trendlines are important. I’ll end with a snapshot to illustrate the level.
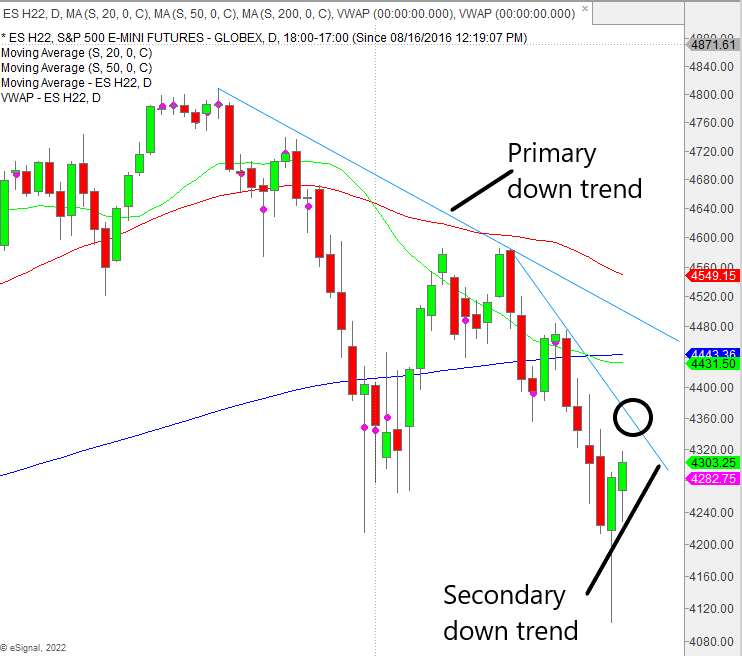
/ES Daily
VPOC’s
- 01.05 4780.00
- 01.14 4632.00
Scenarios
- On the true gapThere is a lot of discussion as to what constitutes a gap. Is it measured to the prior day's close, or to the prior day's high or low? Here at ShadowTrader, we believe that it is always and only to a prior day's high or low, thus creating a true gap or space on the chart between one day and the next. Thus a true gap is one that has price opening completely outside of the prior day's range (either above the high or below the low) and anything else is just a gap that has far less import. As a gap is a "reordering of thinking", only a true gap really changes the tone and creates opportunity to trade earlier (near the open) rather than later. More higher, focus first on whether or not there is a gap fill and if so, how much. Given that sellers seem to be a big on their heels, I’m seeing the RTHRegular Trading Hours. In the /ES this means the price action from 9:30am EST to 4:15pm EST only. High as a potential buy point. Failure to fill the gap fully would be a very bullish signal and traders should target the ONHOvernight High. A term mostly used in describing the futures market which has an overnight session and trades almost around the clock. To be precise, in the /ES this is the high made between 4:30pm EST and 9:30am EST the next day. and beyond, monitoring for continuation. Finding acceptanceWhen the market profile begins to build out or develop in a certain area, it is said that the market is accepting those prices. This can be measured either in time spent or amount of volume that is transacted. It is generally understood that ShadowTrader defines acceptance as more of a time dynamic than a volume one. A good rule of thumb is to look for at least two TPO periods to print in the accepted area. The acceptance confirms that a significant amount of market participants are transacting at those levels. Acceptance is the opposite of rejection. More within range today changes the tone slightly but it will be all about how deep we go. As mentioned above, we want to see if the ONLOvernight Low. A term mostly used for the futures market as it trades almost around the clock. To be precise, in the /ES this would be the lowest price between 4:30pm EST and 9:30am EST the next day. is secure or not.
- Keep spike rulesA framework for analyzing a spike on the next trading day after it is formed.
Because the spike forms late in the day, it is impossible to gauge whether or not the higher or lower prices that have run quickly away from value will be deemed fair later. Thus we employ the spike rules in the next session.
Everything below is assuming a spike at the TOP of a daily range (reverse for a spike at the BOTTOM of a range)
-If prices open above the spike, that is considered bullish and tells us that prices didn't auction high enough in the spike to attract sellers and cut off buying activity. Monitor to see if there is acceptance above the spike.
-Prices opening within the spike confirm the higher prices of the spike. This tells us that the prices are fair enough for two sided... in mind as well today. Ideally for buyers to remain in strong control, all activity should be either within or above the spikeA set of single prints that are created in the last 30 minute session of the day which form at the top or bottom of a range. and not below. AcceptanceWhen the market profile begins to build out or develop in a certain area, it is said that the market is accepting those prices. This can be measured either in time spent or amount of volume that is transacted. It is generally understood that ShadowTrader defines acceptance as more of a time dynamic than a volume one. A good rule of thumb is to look for at least two TPO periods to print in the accepted area. The acceptance confirms that a significant amount of market participants are transacting at those levels. Acceptance is the opposite of rejection. More below the spikeA set of single prints that are created in the last 30 minute session of the day which form at the top or bottom of a range. low would start to put the reversal into question.
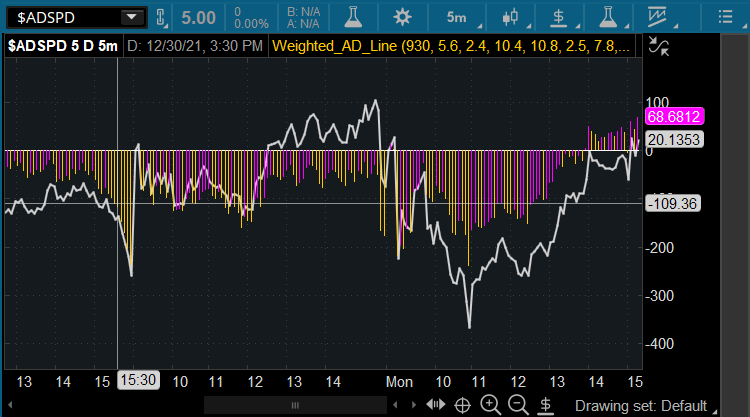
Weighted S&P A/D Line Indicator
This script plots both an unweighted and a weighted A/D line using the 11 S&P sectors and their respective weights. This gives the trader a huge edge in discerning the strength of moves and also knowing when there is positive or negative divergence in heavier versus lighter weighted sectors as the day unfolds.
GET YOURS NOW

