The Market Profile value areas and ShadowTrader Pivots for /ESH19 and /NQH19 Futures are posted free every morning
in the ShadowTrader Swing Trader newsletter.
Lots to talk about this morning, plenty of market generated information out there. Let’s get to the market profile….
Now THAT’S some serious short covering!
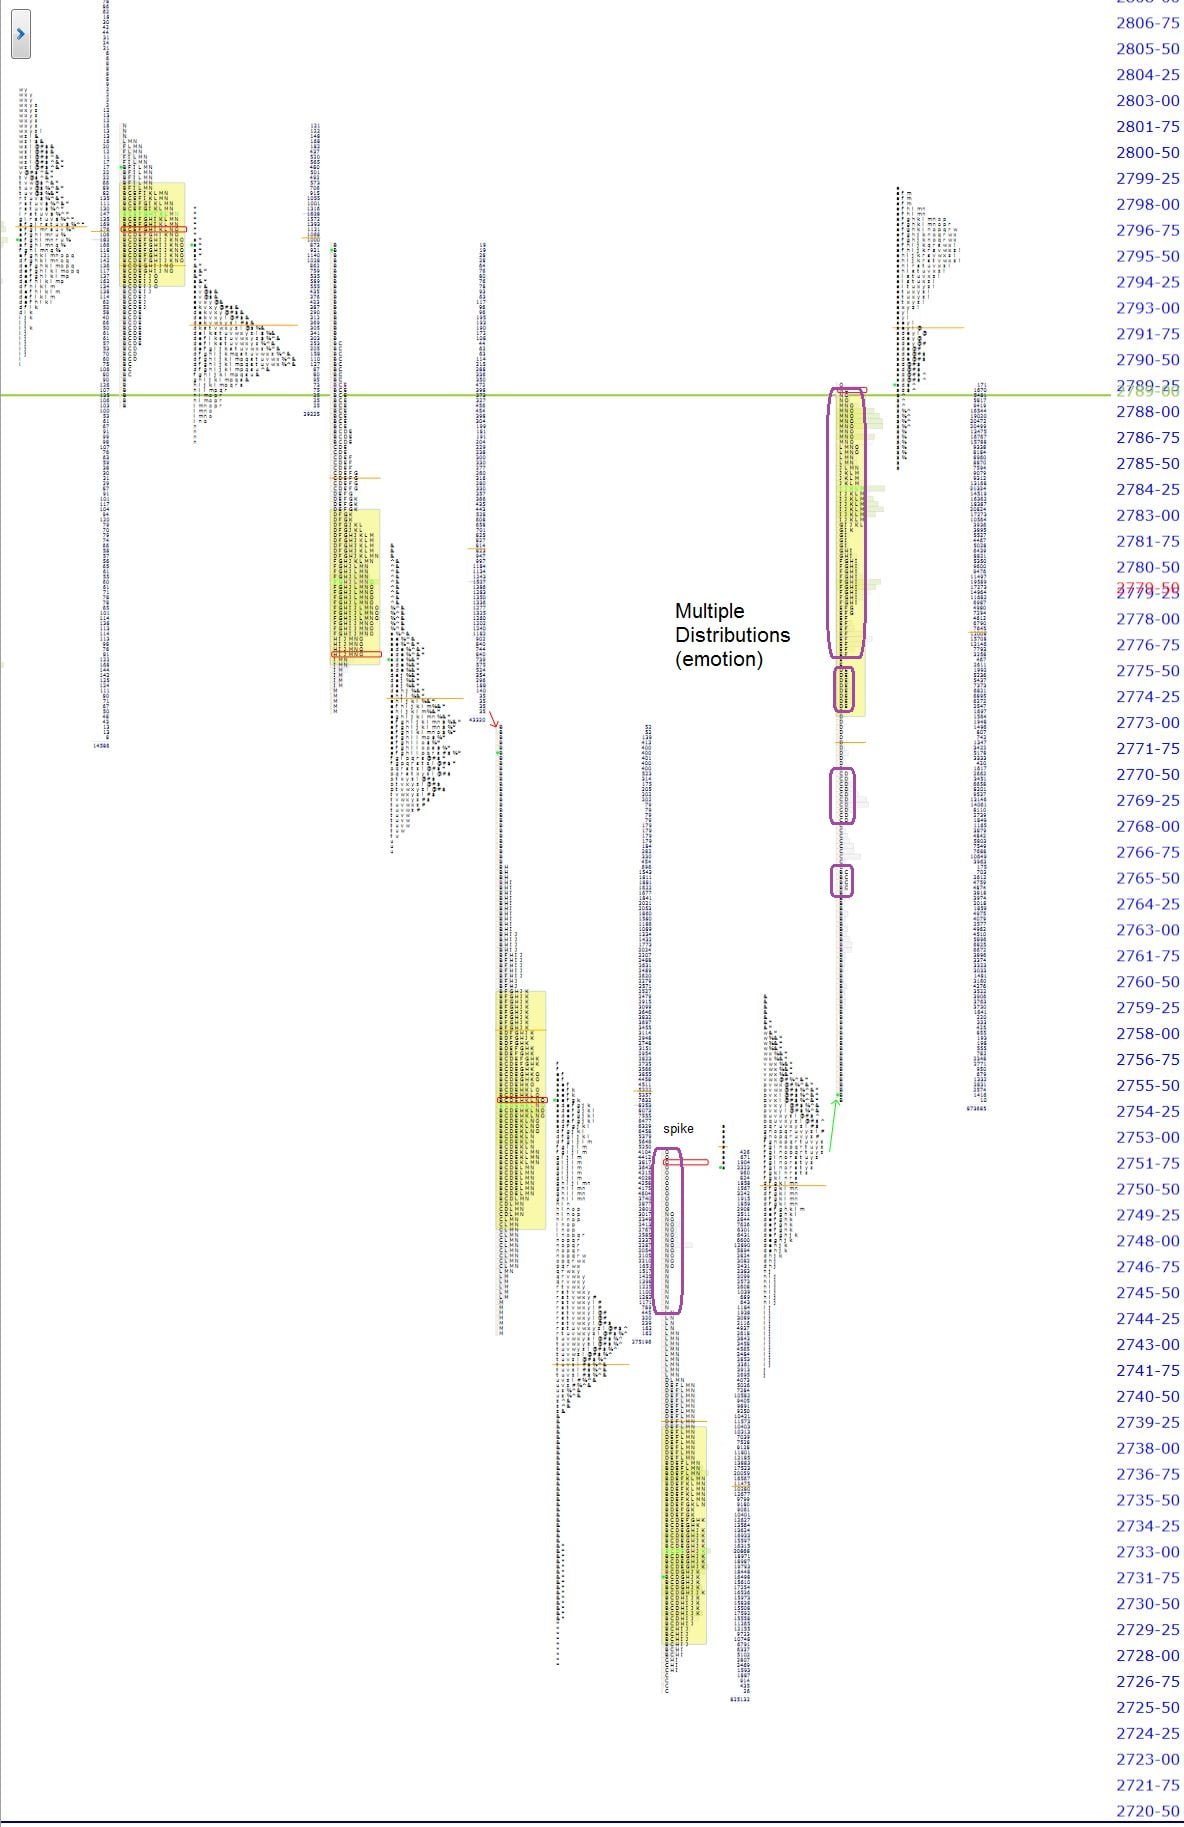
Let’s begin by updating our narrative by taking a closer look at the last two trading sessions. Friday was our reversal day which culminated in a spikeA set of single prints that are created in the last 30 minute session of the day which form at the top or bottom of a range. at the top of the market profileA way of reading the market that recognizes either time spent or volume traded at a particular price level. A market profile can be either made up of “TPO’s” (time price opportunities), or volume. TPO’s measure how much time was spent at a particular price, while volume-based market profiles measure how much volume traded at a particular price. Generally, market profile is used in the trading of futures, especially the /ES. ShadowTrader utilizes volume based profiles. distribution. Spike rulesA framework for analyzing a spike on the next trading day after it is formed.
Because the spike forms late in the day, it is impossible to gauge whether or not the higher or lower prices that have run quickly away from value will be deemed fair later. Thus we employ the spike rules in the next session.
Everything below is assuming a spike at the TOP of a daily range (reverse for a spike at the BOTTOM of a range)
-If prices open above the spike, that is considered bullish and tells us that prices didn't auction high enough in the spike to attract sellers and cut off buying activity. Monitor to see if there is acceptance above the spike.
-Prices opening within the spike confirm the higher prices of the spike. This tells us that the prices are fair enough for two sided... yesterday morning told us that the most bullish outcome was an open above the spikeA set of single prints that are created in the last 30 minute session of the day which form at the top or bottom of a range. which didn’t have any acceptanceWhen the market profile begins to build out or develop in a certain area, it is said that the market is accepting those prices. This can be measured either in time spent or amount of volume that is transacted. It is generally understood that ShadowTrader defines acceptance as more of a time dynamic than a volume one. A good rule of thumb is to look for at least two TPO periods to print in the accepted area. The acceptance confirms that a significant amount of market participants are transacting at those levels. Acceptance is the opposite of rejection. More at all within the spikeA set of single prints that are created in the last 30 minute session of the day which form at the top or bottom of a range.. That’s pretty much exactly what we got yesterday morning as S&P futures gapped and held staging an all day trending day advance.
Yesterday’s profile with it’s four separate distributions could easily be summarized in one phrase which would be “I’m so short, get me out NOW”. There was no pullback all day, not even the classic 2 or 2:30pm EST variety which allows the 15 minute RTHRegular Trading Hours. In the /ES this means the price action from 9:30am EST to 4:15pm EST only. only 20SMA to catch up to prices. In almost every trending day, there is always one break of one time framingA trending situation where in an uptrend the low of the previous bar or TPO period is not broken by two ticks or more. In a downtrend it would be reversed and the high of any previous bar or TPO period is not broken by two ticks or more. Note that if you are one time framing to the upside, it is not necessary for the bars to make higher highs. The one time framing is only concerned with the lows. If one time framing to the downside, then it is not necessary to make lower lows as the one time framing is only concerned with the highs. One time framing can be identified on any timeframe or even down to the TPO. Thus, a five minute chart could be one time framing to the upside where it is constantly putting in higher lows but the daily chart is not. If looking very granular at the TPO level, y... More before closing higher. As shown in the picture of the expanded profile below, yesterday did not possess that characteristic. This is rare and should be carried forward into today’s session. What should you carry forward you might ask? The fact that the market is slightly more short term overbought than it would be had this pullback occurred.
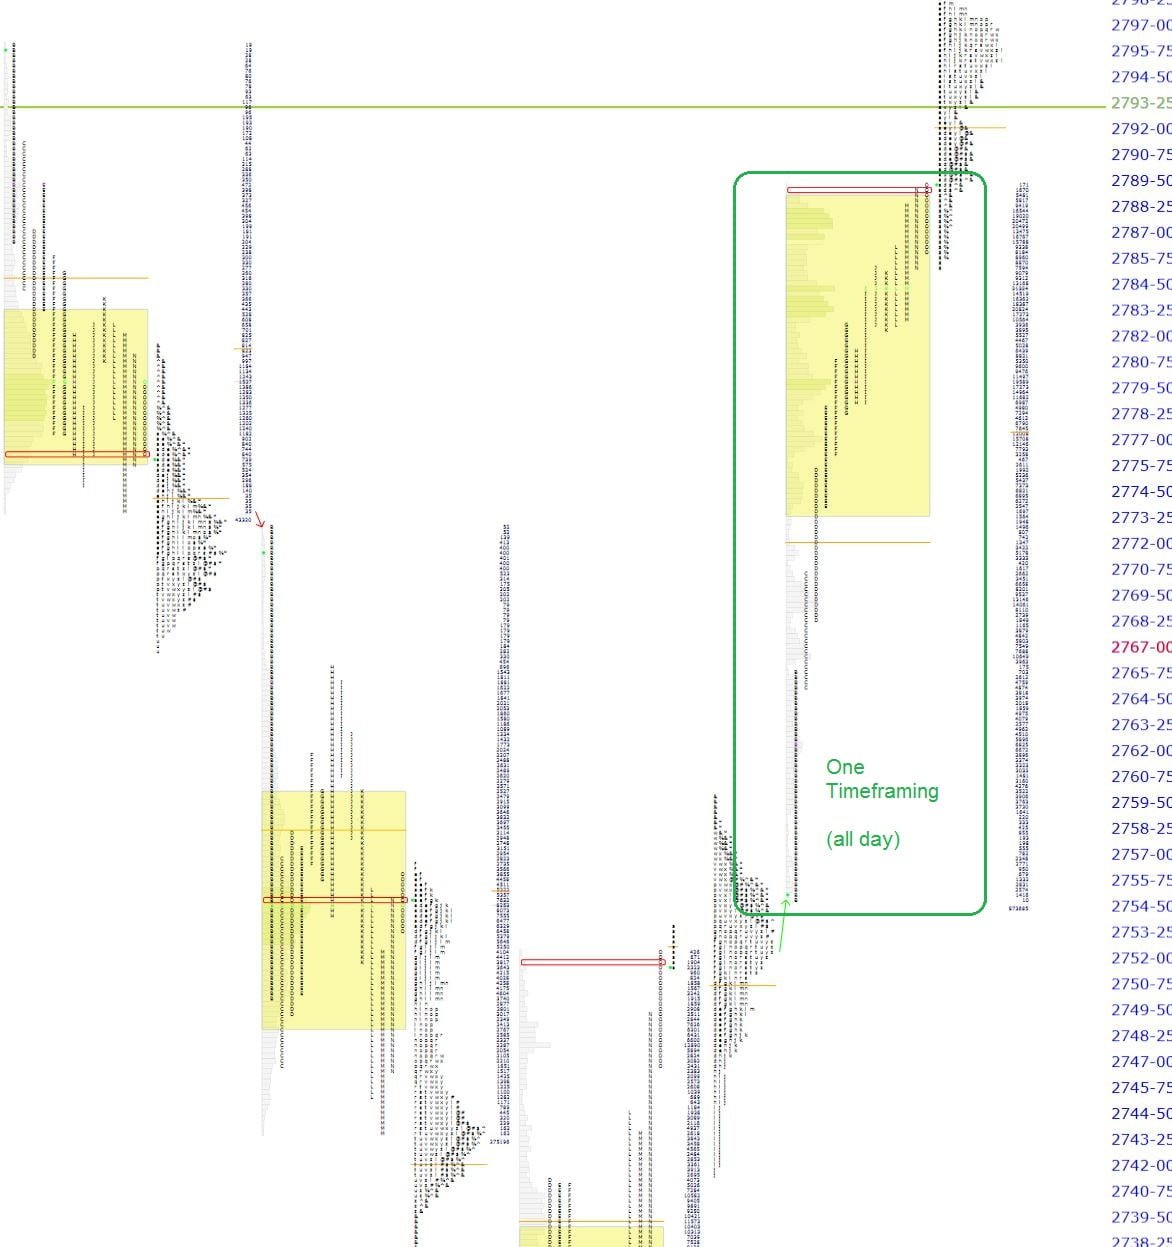
One timeframing
Coming into today’s trade, we have futures currently adding on a bit to yesterday’s gains with a current true gapThere is a lot of discussion as to what constitutes a gap. Is it measured to the prior day's close, or to the prior day's high or low? Here at ShadowTrader, we believe that it is always and only to a prior day's high or low, thus creating a true gap or space on the chart between one day and the next. Thus a true gap is one that has price opening completely outside of the prior day's range (either above the high or below the low) and anything else is just a gap that has far less import. As a gap is a "reordering of thinking", only a true gap really changes the tone and creates opportunity to trade earlier (near the open) rather than later. More of +5.75 in the S&P and +24.50 in the Nasdaq 100’s. Overnight inventoryA way of measuring overnight activity in the futures market by just noting how much of the overnight activity happens to fall above the prior day's settlement value (4:15pm EST close) and how much falls below. If more activity is above the settlement, then overnight inventory is said to be net long. If more is below, then it is said to be net short. If all of the overnight activity is above the settlement, then it is said to be 100% net long. If all of the activity is below the settlement then it is said to be 100% net short. The overnight inventory situation matters most and has the most impact on early trade when it is skewed 100% in either direction because when the imbalance is very large like that then the odds of an early correction increase greatly. This is due to the fact that most... is net long but not 100% so. The ONHOvernight High. A term mostly used in describing the futures market which has an overnight session and trades almost around the clock. To be precise, in the /ES this is the high made between 4:30pm EST and 9:30am EST the next day. is at 2799.00 which is not surprising as that is a psychological resistance. Some backing and filling would be healthy here to solidify this rally a bit more. If we don’t get any of that today, given the overnight inventoryA way of measuring overnight activity in the futures market by just noting how much of the overnight activity happens to fall above the prior day's settlement value (4:15pm EST close) and how much falls below. If more activity is above the settlement, then overnight inventory is said to be net long. If more is below, then it is said to be net short. If all of the overnight activity is above the settlement, then it is said to be 100% net long. If all of the activity is below the settlement then it is said to be 100% net short. The overnight inventory situation matters most and has the most impact on early trade when it is skewed 100% in either direction because when the imbalance is very large like that then the odds of an early correction increase greatly. This is due to the fact that most... situation and the lack of pullback yesterday afternoon, it is a strong sign of strength. Gap rulesGuidelines to follow on any day that the futures open outside of the prior day's RTH range. Only opening outside of range is a true gap and puts gap rules in play. 1. Go with all gaps that don't fill right away. This means that if early trade doesn't start to correct the imbalance, then prices will probably move in the direction of the gap. 2. Larger gaps can often fail to fill on the first day or may fill only partially. 3. If the gap fills (meaning the prior day's RTH high is touched on a gap up or the prior day's RTH low is touched on a gap down) and value cannot get to at least overlapping, then the odds of a late day rally (on a gap up) or late day selloff (on a gap down) increase. 4. Gaps of larger than $20 in the /ES are difficult to trade and should be avoided early in the day as t... More are in play.
On the downside, my main reference point would have to be the RTHRegular Trading Hours. In the /ES this means the price action from 9:30am EST to 4:15pm EST only. high at 2790.00 which would represent a move back inside of yesterday’s range. Given the poor structure of yesterday (four separate distributions separated by single printsAny section of the market profile distribution that is only one TPO wide. Single prints are a sign of emotional buying or selling as very little time was spent at those levels and thus there is no value there. The endpoints of single print sections are considered to be potential support or resistance points.), some long liquidation could occur on such a move back into range. As always, be vigilant all day and note all things that should happen but don’t. They are often the most important pieces of market generated information you can find. Remember that every distribution in yesterday’s profile should be treated separately and the single printsAny section of the market profile distribution that is only one TPO wide. Single prints are a sign of emotional buying or selling as very little time was spent at those levels and thus there is no value there. The endpoints of single print sections are considered to be potential support or resistance points. that separate them are very often supports.
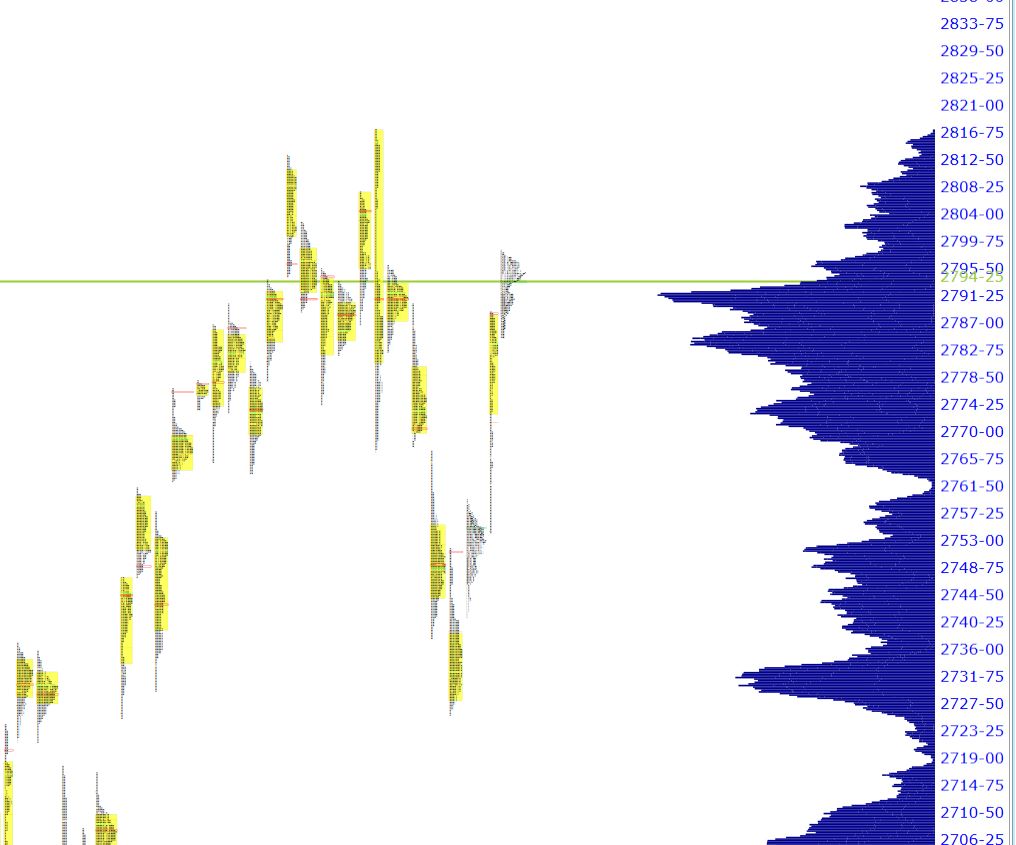
Lastly, a brief “look to the left” will show that current prices around low 2790’s are in a high volume node. This can also cause prices to be “sticky” for a bit and some consolidation may occur here. I’ve included a shot of the composite profileA market profile chart that aggregates all of the volume of all of its distribution along the Y axis, forming peaks and valleys in areas of high and low volume. below showing this activity.
Fair prices, indeed….
Have a wonderful day,
-peter


