
- Relatively weak overnight pullback that didn’t even test the first single print section of Friday’s RTHRegular Trading Hours. In the /ES this means the price action from 9:30am EST to 4:15pm EST only. distribution.
- Friday’s RTHRegular Trading Hours. In the /ES this means the price action from 9:30am EST to 4:15pm EST only. High was right into a downtrend line on the daily /ES
- TNX up slightly and testing 8EMA from bottom. Potentially key development if it breaks above (video)
- Buyers are firmly in control. Assume pullbacks are buyable if price above the ONLOvernight Low. A term mostly used for the futures market as it trades almost around the clock. To be precise, in the /ES this would be the lowest price between 4:30pm EST and 9:30am EST the next day..
| Pre Market Indications | ||
| Opening In/Out Balance | in balance | |
| Overnight InventoryA way of measuring overnight activity in the futures market by just noting how much of the overnight activity happens to fall above the prior day's settlement value (4:15pm EST close) and how much falls below. If more activity is above the settlement, then overnight inventory is said to be net long. If more is below, then it is said to be net short. If all of the overnight activity is above the settlement, then it is said to be 100% net long. If all of the activity is below the settlement then it is said to be 100% net short. The overnight inventory situation matters most and has the most impact on early trade when it is skewed 100% in either direction because when the imbalance is very large like that then the odds of an early correction increase greatly. This is due to the fact that most... | 100% net shortThe concept of being more short than long in an options spread by creating options spreads where you are selling more structures than you are buying or selling wider structures than the ones you are buying. Example would be a broken wing butterfly. This spread is made up of two structures, one long vertical and one short vertical. In the BWB, the short vertical is wider than the long vertical. When you are long this spread, you are said to be in an options position that is "net short" | |
| Current Price/Overnight Range | upper third | |
| Shock and AweA term Peter uses to describe what overnight futures traders may be feeling when faced with an open that is wildly divergent from what they expected. Large gaps in either direction that are opening well outside of range are examples of this. The approach is that when the market opens in such a manner, there is often opportunity to trade earlier rather than later because of the large contingent of traders who will be forced to reverse their positions quickly. | no | |
| Potential for Early Trade | no | |
| Short Term Bias | bullish | |
Scenarios
- The only potential for change would be a move below the ONLOvernight Low. A term mostly used for the futures market as it trades almost around the clock. To be precise, in the /ES this would be the lowest price between 4:30pm EST and 9:30am EST the next day.. If so, then target the Bottom of the Single PrintsAny section of the market profile distribution that is only one TPO wide. Single prints are a sign of emotional buying or selling as very little time was spent at those levels and thus there is no value there. The endpoints of single print sections are considered to be potential support or resistance points. and monitor for continuation.
- Failure to test the ONL would be bullish and any pullbacks within that o/n range would be considered buyable.
- As dicussed in video, there is still a portion of an older gap unfilled above the RTHRegular Trading Hours. In the /ES this means the price action from 9:30am EST to 4:15pm EST only. High. Traders can treat that as a breakout point and target that full gap fill.
- Friday was a clear expansion of range (excess) so don’t disount the potential for more two sided trade (balance).
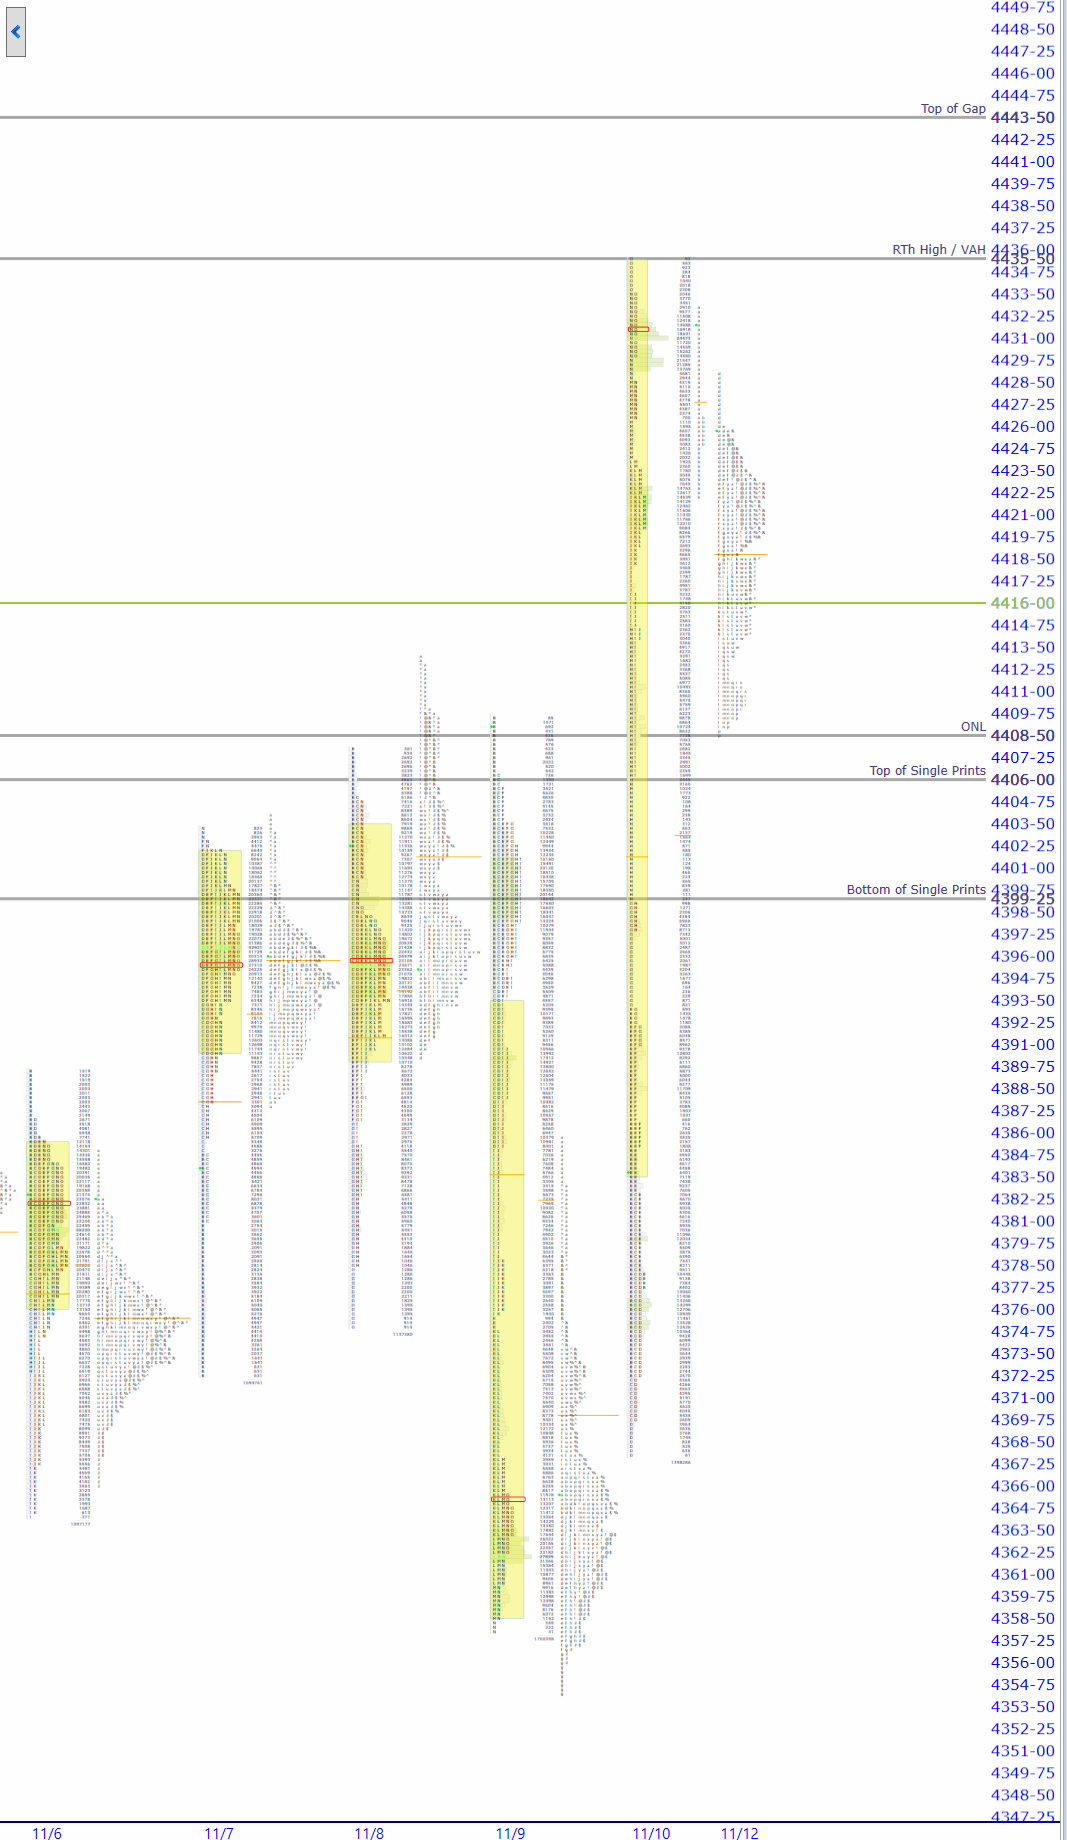
| Today’s Market ProfileA way of reading the market that recognizes either time spent or volume traded at a particular price level. A market profile can be either made up of “TPO’s” (time price opportunities), or volume. TPO’s measure how much time was spent at a particular price, while volume-based market profiles measure how much volume traded at a particular price. Generally, market profile is used in the trading of futures, especially the /ES. ShadowTrader utilizes volume based profiles. Chart |
The chart provided is from WindoTrader. CLICK HERE to learn more about the ShadowTrader discount. Interpret the chart above with the Market Profile Key.
| Key Levels for Today | ||
| 4443.50 | Top of Gap | |
| 4435.50 | RTHRegular Trading Hours. In the /ES this means the price action from 9:30am EST to 4:15pm EST only. High / VALValue Area Low | |
| 4408.50 | ONLOvernight Low. A term mostly used for the futures market as it trades almost around the clock. To be precise, in the /ES this would be the lowest price between 4:30pm EST and 9:30am EST the next day. | |
| 4406.00 | Top of Single PrintsAny section of the market profile distribution that is only one TPO wide. Single prints are a sign of emotional buying or selling as very little time was spent at those levels and thus there is no value there. The endpoints of single print sections are considered to be potential support or resistance points. | |
| Virgin Point of ControlAlso called “POC” for short. The level in the futures inside the value area where either the greatest amount of volume traded in the prior session, or the greatest amount of time was spent as measured by the number of TPO’s going across. Measured this way, the POC would be the widest part of any given market profile. While ShadowTrader calculates its value areas and points of control using volume exclusively, we are always very aware of where the TPO POC is and it’s relation to current prices or patterns in the profile. Both are very important. (VPOCVirgin Point of Control. This is a point of control level that has not yet been tested (traded through) during an RTH session. If the POC gets tested during an overnight session, it does not count and remains "virgin" until it happens during a day session.) | ||
| 09.14.2023 | 4554.75 | |
| 09.20.2023 | 4499.25 | |
| 11.02.2023 | 4336.00 | |
| 10.24.2023 | 4270.50 | |
| 10.27.2023 | 4138.00 | |
| Today’s ESThe S&P 500 e-mini contract. In the broadcast we use this as our primary instrument to define market direction and effect short term trades when we have a bias in the market. This is the electronic contract that trades around the clock, as opposed to the pit traded contract. Sometimes the pit traded version is called the “big contract”. Futures contracts on are denoted by two letters and then a letter and a number to define their expiration month. The ES has four contract periods per year which expire in March, June, September, and December. These four months are denoted by the letters H, M, U, and Z. For example, if it was 2012, then the March contract would be called the /ESH2. Thinkorswim requires a forward slash before the letters. Certain trading platforms and charting packages ma... and NQThe Nasdaq 100 E-Mini futures. In the broadcast we only discuss this contract in the pre-market to get a feel for where the Nasdaq will open. Market ProfileA way of reading the market that recognizes either time spent or volume traded at a particular price level. A market profile can be either made up of “TPO’s” (time price opportunities), or volume. TPO’s measure how much time was spent at a particular price, while volume-based market profiles measure how much volume traded at a particular price. Generally, market profile is used in the trading of futures, especially the /ES. ShadowTrader utilizes volume based profiles. and Pivot Point Numbers | ||
| Value Area HighThe high end of the range of the value area. | 4435.50 | 15607.50 |
| Point of ControlAlso called “POC” for short. The level in the futures inside the value area where either the greatest amount of volume traded in the prior session, or the greatest amount of time was spent as measured by the number of TPO’s going across. Measured this way, the POC would be the widest part of any given market profile. While ShadowTrader calculates its value areas and points of control using volume exclusively, we are always very aware of where the TPO POC is and it’s relation to current prices or patterns in the profile. Both are very important. | 4431.00 | 15599.50 |
| Value Area LowThe low end of the range of the value area. | 4383.50 | 15373.50 |
| R3 | 4522.50 | 16002.50 |
| R2 | 4479.00 | 15805.00 |
| R1 | 4454.75 | 15700.50 |
| Pivot | 4411.25 | 15503.00 |
| S1 | 4387.00 | 15398.50 |
| S2 | 4343.50 | 15201.00 |
| S3 | 4319.25 | 15096.50 |


