Market ProfileA way of reading the market that recognizes either time spent or volume traded at a particular price level. A market profile can be either made up of “TPO’s” (time price opportunities), or volume. TPO’s measure how much time was spent at a particular price, while volume-based market profiles measure how much volume traded at a particular price. Generally, market profile is used in the trading of futures, especially the /ES. ShadowTrader utilizes volume based profiles. ValueThis value has nothing to do with valuation. It denotes prices that are "fair". Fair in this sense means a price that is common to a lot of participants. An item that you buy once per week in a store at a price that doesn't fluctuate has a "fair price". You can express this by a formula Value = Price + Time or Value = Price + Volume Either of the above are valid ways of expressing value. In the first equation, value is defined by price staying the same for a long period of time. In the futures market, this would be an area that is revisted a lot during a particular session or multiple sessions. The point of control is the price level where the most amount of time was spent during an RTH session. James Dalton refers to this level as "the fairest price to do business". Using vo... More Areas and POCPoint of Control, also known as the "fairest price to do business". It is the price level in the /ES where the greatest amount of volume in the prior RTH session traded. ShadowTrader measures the POC using volume but the traditional way is to mark off the widest point of the day's distribution where the most TPO's printed going across from left to right, indicating that that was the price where the most time was spent. It's important to pay attention to both the volume POC and the TPO POC. figures for /ESH7 and /NQH7 Futures are posted free every morning HERE. Click on any posts in the list on the left pane to see them in the main window. Don’t click on the ST logo as it will just refresh the page and you’ll get only the topmost post over and over. Click on the title or text.
Liquidation breakA sudden selloff in the market that has the following characteristics:
-Often happens very early or late in the day
-Comes out of a pattern that doesn’t suggest such a break should occur
-Has no definitive catalyst or news that drives it
-Has much faster tempo than the one that has already been established
-Is often short-lived and will retrace 100% soon after or the next day
A liquidation break happens when short term traders get overly long and all panic out at once. It is different from a stronger, more lasting correction in that there are usually only very short timeframe players involved, usually those who got most recently long at poor location. yesterday from the open to correct overnight inventoryA way of measuring overnight activity in the futures market by just noting how much of the overnight activity happens to fall above the prior day's settlement value (4:15pm EST close) and how much falls below. If more activity is above the settlement, then overnight inventory is said to be net long. If more is below, then it is said to be net short. If all of the overnight activity is above the settlement, then it is said to be 100% net long. If all of the activity is below the settlement then it is said to be 100% net short. The overnight inventory situation matters most and has the most impact on early trade when it is skewed 100% in either direction because when the imbalance is very large like that then the odds of an early correction increase greatly. This is due to the fact that most... that was 100% net long and also slap some light volume late to the party longs.
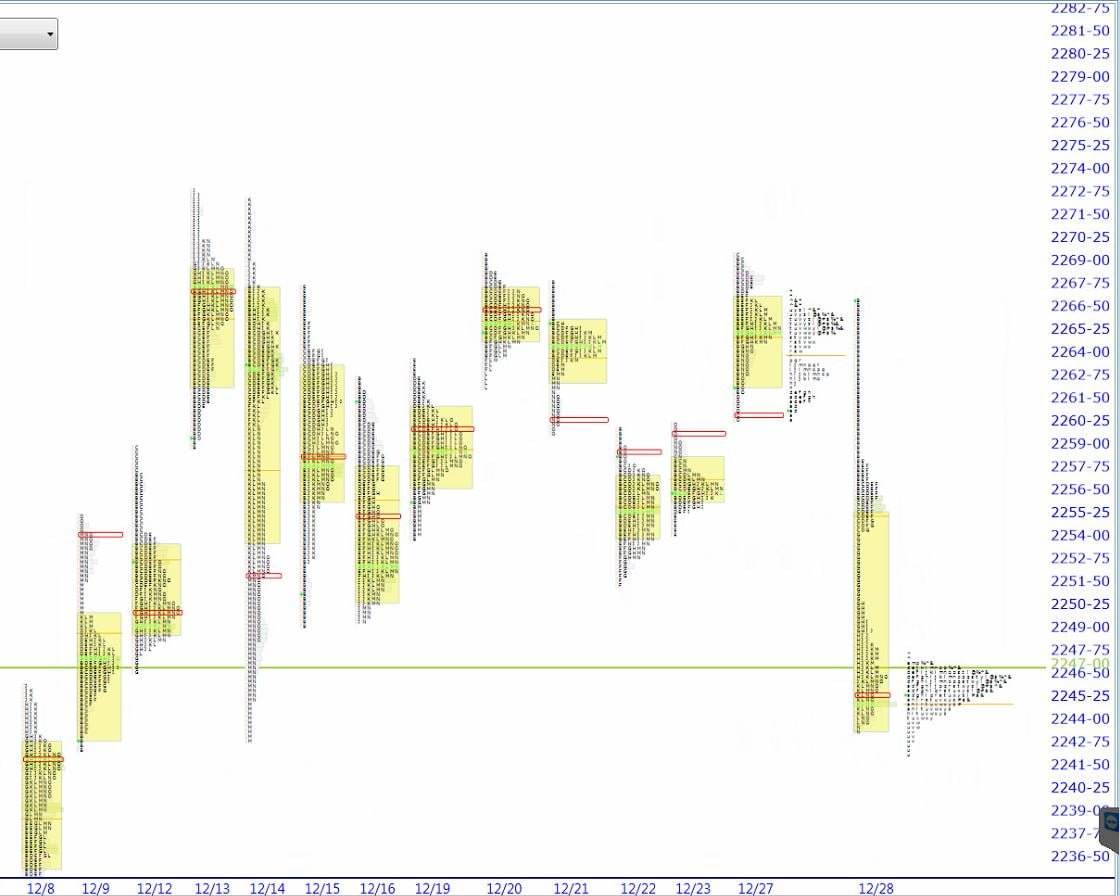
Volume was still on the lower end and structure was poor with double distributionA market profile distribution that is split into two distributions that are separated by single prints. The general rule of thumb is to treat each distribution as if it were a separate day. Judge the current day's bullishness or bearishness by which of the prior day's distributions you find acceptance in. The end points of the single prints are often support or resistant points as well. separated by single printsAny section of the market profile distribution that is only one TPO wide. Single prints are a sign of emotional buying or selling as very little time was spent at those levels and thus there is no value there. The endpoints of single print sections are considered to be potential support or resistance points.. 2254.75 down to 2250.75 is the length of the spikeA set of single prints that are created in the last 30 minute session of the day which form at the top or bottom of a range. that separates the two. Pay attention to both of these levels. As always, acceptanceWhen the market profile begins to build out or develop in a certain area, it is said that the market is accepting those prices. This can be measured either in time spent or amount of volume that is transacted. It is generally understood that ShadowTrader defines acceptance as more of a time dynamic than a volume one. A good rule of thumb is to look for at least two TPO periods to print in the accepted area. The acceptance confirms that a significant amount of market participants are transacting at those levels. Acceptance is the opposite of rejection. More in the lower distribution is more bearish, acceptanceWhen the market profile begins to build out or develop in a certain area, it is said that the market is accepting those prices. This can be measured either in time spent or amount of volume that is transacted. It is generally understood that ShadowTrader defines acceptance as more of a time dynamic than a volume one. A good rule of thumb is to look for at least two TPO periods to print in the accepted area. The acceptance confirms that a significant amount of market participants are transacting at those levels. Acceptance is the opposite of rejection. More in the upper one is less so.
I am seeing the lower bound of this larger balance area as being 2243.00. Note how the ONLOvernight Low. A term mostly used for the futures market as it trades almost around the clock. To be precise, in the /ES this would be the lowest price between 4:30pm EST and 9:30am EST the next day. went down to 2242.25 but no further and has since reversed. That is of note. Could be a look below and failA specific type of market movement where prices fall below the low of a balance area and then rise back into the balance area. The theory is that if this happens, there are strong odds that there will be price rotation back up to the high of the balance area. Look below and fail is specific to activity around balance areas only. Falling below a prior day's low or any technical level and rising back above it is not a "look below and fail". More which would signal that short covering rotation back to high end of range could be an option. AcceptanceWhen the market profile begins to build out or develop in a certain area, it is said that the market is accepting those prices. This can be measured either in time spent or amount of volume that is transacted. It is generally understood that ShadowTrader defines acceptance as more of a time dynamic than a volume one. A good rule of thumb is to look for at least two TPO periods to print in the accepted area. The acceptance confirms that a significant amount of market participants are transacting at those levels. Acceptance is the opposite of rejection. More below the ONLOvernight Low. A term mostly used for the futures market as it trades almost around the clock. To be precise, in the /ES this would be the lowest price between 4:30pm EST and 9:30am EST the next day. would be more bearish and represent more of a break out to the downside.
Overnight inventoryA way of measuring overnight activity in the futures market by just noting how much of the overnight activity happens to fall above the prior day's settlement value (4:15pm EST close) and how much falls below. If more activity is above the settlement, then overnight inventory is said to be net long. If more is below, then it is said to be net short. If all of the overnight activity is above the settlement, then it is said to be 100% net long. If all of the activity is below the settlement then it is said to be 100% net short. The overnight inventory situation matters most and has the most impact on early trade when it is skewed 100% in either direction because when the imbalance is very large like that then the odds of an early correction increase greatly. This is due to the fact that most... is in a tight range and balance and as of now we would be opening within yesterday’s RTHRegular Trading Hours. In the /ES this means the price action from 9:30am EST to 4:15pm EST only. range. I will be paying attention to yesterday’s RTHRegular Trading Hours. In the /ES this means the price action from 9:30am EST to 4:15pm EST only. low today. If yesterday’s break was anything more than a one day event, then prices should at least make a fresh two day low.
Have a nice day,
peter


