Market ProfileA way of reading the market that recognizes either time spent or volume traded at a particular price level. A market profile can be either made up of “TPO’s” (time price opportunities), or volume. TPO’s measure how much time was spent at a particular price, while volume-based market profiles measure how much volume traded at a particular price. Generally, market profile is used in the trading of futures, especially the /ES. ShadowTrader utilizes volume based profiles. ValueThis value has nothing to do with valuation. It denotes prices that are "fair". Fair in this sense means a price that is common to a lot of participants. An item that you buy once per week in a store at a price that doesn't fluctuate has a "fair price". You can express this by a formula Value = Price + Time or Value = Price + Volume Either of the above are valid ways of expressing value. In the first equation, value is defined by price staying the same for a long period of time. In the futures market, this would be an area that is revisted a lot during a particular session or multiple sessions. The point of control is the price level where the most amount of time was spent during an RTH session. James Dalton refers to this level as "the fairest price to do business". Using vo... More Areas and POCPoint of Control, also known as the "fairest price to do business". It is the price level in the /ES where the greatest amount of volume in the prior RTH session traded. ShadowTrader measures the POC using volume but the traditional way is to mark off the widest point of the day's distribution where the most TPO's printed going across from left to right, indicating that that was the price where the most time was spent. It's important to pay attention to both the volume POC and the TPO POC. figures for /ESH7 and /NQH7 Futures are posted free every morning HERE. Click on any posts in the list on the left pane to see them in the main window. Don’t click on the ST logo as it will just refresh the page and you’ll get only the topmost post over and over. Click on the title or text.
ValueThis value has nothing to do with valuation. It denotes prices that are "fair". Fair in this sense means a price that is common to a lot of participants. An item that you buy once per week in a store at a price that doesn't fluctuate has a "fair price". You can express this by a formula Value = Price + Time or Value = Price + Volume Either of the above are valid ways of expressing value. In the first equation, value is defined by price staying the same for a long period of time. In the futures market, this would be an area that is revisted a lot during a particular session or multiple sessions. The point of control is the price level where the most amount of time was spent during an RTH session. James Dalton refers to this level as "the fairest price to do business". Using vo... More has been very overlapping to down over the last four sessions. While the market sits atop all time highs, there are very few stronger sellers present at the moment. Profile and T/A references are working very well.
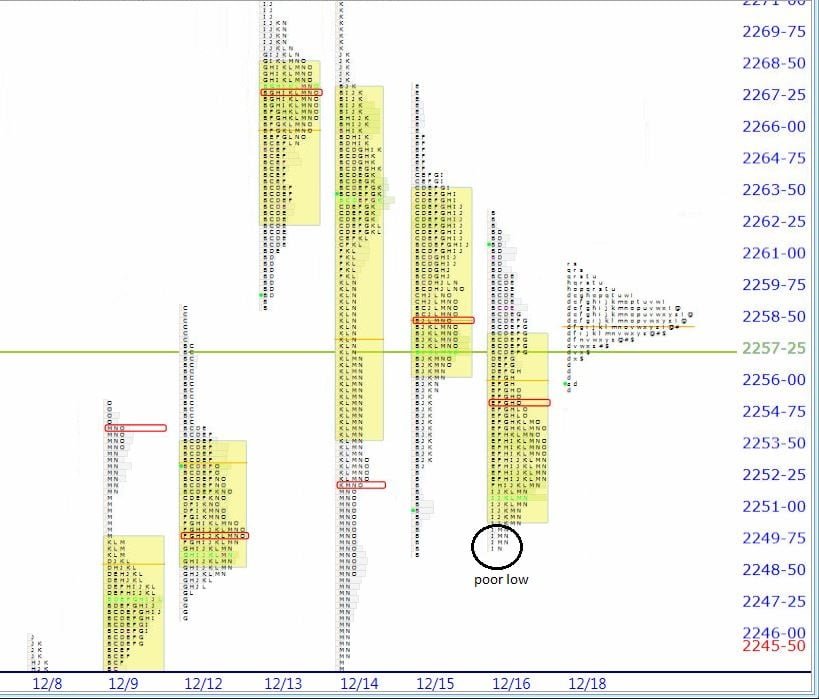
Friday’s low came to within one tickThe net cumulative tick reading on the NYSE or Nasdaq Composite. This is measured by the number of stocks ticking up minus the number of stocks ticking down at any given moment. It is the least used of the internal indicators but is discussed from time to time. Generally the tick readings are only helpful when they are at extremes such as +1000 on the NYSE to indicate that program trading is ensuing. of Thursday’s low and stopped. The low was also poor indicative of weaker sellers painting themselves into a corner by not being able to get follow on sellers to move prices lower. All poor lows/highs should be carried forward but this one especially as it is a double bottom. Additionally, while I didn’t draw it in on the market profileA way of reading the market that recognizes either time spent or volume traded at a particular price level. A market profile can be either made up of “TPO’s” (time price opportunities), or volume. TPO’s measure how much time was spent at a particular price, while volume-based market profiles measure how much volume traded at a particular price. Generally, market profile is used in the trading of futures, especially the /ES. ShadowTrader utilizes volume based profiles. graphic above, one could draw a 45 degree lineThe 45 degree line is an interesting market profile nuance. It occurs when a 45 degree line can be drawn from the lowest point of a distribution to its widest point (TPO POC). This is a sign that sellers have painted themselves into a corner near the lows of the session and creates potential for an upward reversal in the next session. As less and less time is spent the closer you get to the low of the session, sellers are essentially initiating shorts at less and less value. 45 degree line lows should be assumed to be secure until they are breached. The pattern is generally only noted in RTH sessions but they have shown to be relatively reliable signals in overnight sessions as well. The obvious question is always whether or not the 45 degree line can be drawn in from the high of the day t... from the low to the TPO(MP) Stands for “Time Price Opportunity”. It is the smallest unit of measure displayed any market profile graphic, denoted by a single letter. Each TPO represents a point of time where the market being charted trades at a specific price. A single TPO is printed on the chart every time that a certain price is touched during any time period. Typically, the periods are set to 30 minutes. Therefore, every different letter that you see in the market profile distribution denotes a different 30 minute period. POCPoint of Control, also known as the "fairest price to do business". It is the price level in the /ES where the greatest amount of volume in the prior RTH session traded. ShadowTrader measures the POC using volume but the traditional way is to mark off the widest point of the day's distribution where the most TPO's printed going across from left to right, indicating that that was the price where the most time was spent. It's important to pay attention to both the volume POC and the TPO POC.. On a scale of 1 – 10 I give that 45 degree lineThe 45 degree line is an interesting market profile nuance. It occurs when a 45 degree line can be drawn from the lowest point of a distribution to its widest point (TPO POC). This is a sign that sellers have painted themselves into a corner near the lows of the session and creates potential for an upward reversal in the next session. As less and less time is spent the closer you get to the low of the session, sellers are essentially initiating shorts at less and less value. 45 degree line lows should be assumed to be secure until they are breached. The pattern is generally only noted in RTH sessions but they have shown to be relatively reliable signals in overnight sessions as well. The obvious question is always whether or not the 45 degree line can be drawn in from the high of the day t... only about a 5.5, however. A more true 45 degree lineThe 45 degree line is an interesting market profile nuance. It occurs when a 45 degree line can be drawn from the lowest point of a distribution to its widest point (TPO POC). This is a sign that sellers have painted themselves into a corner near the lows of the session and creates potential for an upward reversal in the next session. As less and less time is spent the closer you get to the low of the session, sellers are essentially initiating shorts at less and less value. 45 degree line lows should be assumed to be secure until they are breached. The pattern is generally only noted in RTH sessions but they have shown to be relatively reliable signals in overnight sessions as well. The obvious question is always whether or not the 45 degree line can be drawn in from the high of the day t... pattern would have the low further away from the POCPoint of Control, also known as the "fairest price to do business". It is the price level in the /ES where the greatest amount of volume in the prior RTH session traded. ShadowTrader measures the POC using volume but the traditional way is to mark off the widest point of the day's distribution where the most TPO's printed going across from left to right, indicating that that was the price where the most time was spent. It's important to pay attention to both the volume POC and the TPO POC..
Overnight inventoryA way of measuring overnight activity in the futures market by just noting how much of the overnight activity happens to fall above the prior day's settlement value (4:15pm EST close) and how much falls below. If more activity is above the settlement, then overnight inventory is said to be net long. If more is below, then it is said to be net short. If all of the overnight activity is above the settlement, then it is said to be 100% net long. If all of the activity is below the settlement then it is said to be 100% net short. The overnight inventory situation matters most and has the most impact on early trade when it is skewed 100% in either direction because when the imbalance is very large like that then the odds of an early correction increase greatly. This is due to the fact that most... is 100% net long which is not surprising given the patterns discussed above. I tweeted upon Friday’s close that I thought the odds were strong that we would move higher in the overnight session and gap open. While futures are currently are up 2.75, I expected a bit more than that. The RTHRegular Trading Hours. In the /ES this means the price action from 9:30am EST to 4:15pm EST only. session has much more import and sometimes these things take time to develop. That was the subject of a recent recording of ShadowTrader Uncovered If a rally doesn’t develop today, then take it as that the market is not yet overly short and the balancing and slight correction from the most recent longs is continuing.
Have a wonderful day,
peter


