
- Non true gapThere is a lot of discussion as to what constitutes a gap. Is it measured to the prior day's close, or to the prior day's high or low? Here at ShadowTrader, we believe that it is always and only to a prior day's high or low, thus creating a true gap or space on the chart between one day and the next. Thus a true gap is one that has price opening completely outside of the prior day's range (either above the high or below the low) and anything else is just a gap that has far less import. As a gap is a "reordering of thinking", only a true gap really changes the tone and creates opportunity to trade earlier (near the open) rather than later. More lower True gapThere is a lot of discussion as to what constitutes a gap. Is it measured to the prior day's close, or to the prior day's high or low? Here at ShadowTrader, we believe that it is always and only to a prior day's high or low, thus creating a true gap or space on the chart between one day and the next. Thus a true gap is one that has price opening completely outside of the prior day's range (either above the high or below the low) and anything else is just a gap that has far less import. As a gap is a "reordering of thinking", only a true gap really changes the tone and creates opportunity to trade earlier (near the open) rather than later. More higher on 100% net shortThe concept of being more short than long in an options spread by creating options spreads where you are selling more structures than you are buying or selling wider structures than the ones you are buying. Example would be a broken wing butterfly. This spread is made up of two structures, one long vertical and one short vertical. In the BWB, the short vertical is wider than the long vertical. When you are long this spread, you are said to be in an options position that is "net short"
overnight inventoryA way of measuring overnight activity in the futures market by just noting how much of the overnight activity happens to fall above the prior day's settlement value (4:15pm EST close) and how much falls below. If more activity is above the settlement, then overnight inventory is said to be net long. If more is below, then it is said to be net short. If all of the overnight activity is above the settlement, then it is said to be 100% net long. If all of the activity is below the settlement then it is said to be 100% net short. The overnight inventory situation matters most and has the most impact on early trade when it is skewed 100% in either direction because when the imbalance is very large like that then the odds of an early correction increase greatly. This is due to the fact that most... - Sovereign bond yields rising on inflation concerns
- Huge debut for Cerebras (CBRS) fuels worries about AI bubble and near-term market top
- Trump-Xi summit underwhelms with deliverables (reportedly no talk about tariffs, H200 chips, and no asking for favors on Iran)
| Pre Market Indications | ||
| Opening In/Out Balance | out of balance | |
| Overnight InventoryA way of measuring overnight activity in the futures market by just noting how much of the overnight activity happens to fall above the prior day's settlement value (4:15pm EST close) and how much falls below. If more activity is above the settlement, then overnight inventory is said to be net long. If more is below, then it is said to be net short. If all of the overnight activity is above the settlement, then it is said to be 100% net long. If all of the activity is below the settlement then it is said to be 100% net short. The overnight inventory situation matters most and has the most impact on early trade when it is skewed 100% in either direction because when the imbalance is very large like that then the odds of an early correction increase greatly. This is due to the fact that most... | 100% net shortThe concept of being more short than long in an options spread by creating options spreads where you are selling more structures than you are buying or selling wider structures than the ones you are buying. Example would be a broken wing butterfly. This spread is made up of two structures, one long vertical and one short vertical. In the BWB, the short vertical is wider than the long vertical. When you are long this spread, you are said to be in an options position that is "net short" | |
| Current Price/Overnight Range | lower third | |
| Shock and AweA term Peter uses to describe what overnight futures traders may be feeling when faced with an open that is wildly divergent from what they expected. Large gaps in either direction that are opening well outside of range are examples of this. The approach is that when the market opens in such a manner, there is often opportunity to trade earlier rather than later because of the large contingent of traders who will be forced to reverse their positions quickly. | yes | |
| Potential for Early Trade | yes | |
| Short Term Bias | bullish | |
Scenarios
- Gap rulesGuidelines to follow on any day that the futures open outside of the prior day's RTH range. Only opening outside of range is a true gap and puts gap rules in play. 1. Go with all gaps that don't fill right away. This means that if early trade doesn't start to correct the imbalance, then prices will probably move in the direction of the gap. 2. Larger gaps can often fail to fill on the first day or may fill only partially. 3. If the gap fills (meaning the prior day's RTH high is touched on a gap up or the prior day's RTH low is touched on a gap down) and value cannot get to at least overlapping, then the odds of a late day rally (on a gap up) or late day selloff (on a gap down) increase. 4. Gaps of larger than $20 in the /ES are difficult to trade and should be avoided early in the day as t... More are in play. True gapThere is a lot of discussion as to what constitutes a gap. Is it measured to the prior day's close, or to the prior day's high or low? Here at ShadowTrader, we believe that it is always and only to a prior day's high or low, thus creating a true gap or space on the chart between one day and the next. Thus a true gap is one that has price opening completely outside of the prior day's range (either above the high or below the low) and anything else is just a gap that has far less import. As a gap is a "reordering of thinking", only a true gap really changes the tone and creates opportunity to trade earlier (near the open) rather than later. More on 100% net shortThe concept of being more short than long in an options spread by creating options spreads where you are selling more structures than you are buying or selling wider structures than the ones you are buying. Example would be a broken wing butterfly. This spread is made up of two structures, one long vertical and one short vertical. In the BWB, the short vertical is wider than the long vertical. When you are long this spread, you are said to be in an options position that is "net short"
o/n inventory should put focus on the potential fadeWhen a stock moves opposite the direction of its gap on an intraday basis trade first. - Note all signposts from the 5.12 session above current prices. Any of these could stop a rally.
- Today is the first day in some time that he futures market is telegraphing a change in tone. How the RTHRegular Trading Hours. In the /ES this means the price action from 9:30am EST to 4:15pm EST only. session plays out may well be a pivotal day in the market going forward. ValueThis value has nothing to do with valuation. It denotes prices that are "fair". Fair in this sense means a price that is common to a lot of participants. An item that you buy once per week in a store at a price that doesn't fluctuate has a "fair price". You can express this by a formula Value = Price + Time or Value = Price + Volume Either of the above are valid ways of expressing value. In the first equation, value is defined by price staying the same for a long period of time. In the futures market, this would be an area that is revisted a lot during a particular session or multiple sessions. The point of control is the price level where the most amount of time was spent during an RTH session. James Dalton refers to this level as "the fairest price to do business". Using vo... More development, tempoProbably one of the most important and yet overlooked concepts in the market. The tempo is simply the ‘speed’ at which the market is moving. This is also referred to as confidence. Slow tempo is typical of range bound days where there is lots of responsive activity. Fast tempo occurs when there is initiating activity, and market is breaking out of a range. This is not to say that the market can’t have fast tempo on days when it is rotational or moving between the extremes of a value area. It certainly can. Effective intraday futures trading involves gauging the tempo and knowing that opportunities are fewer and smaller when the tempo is slow. See S.O.H., context!
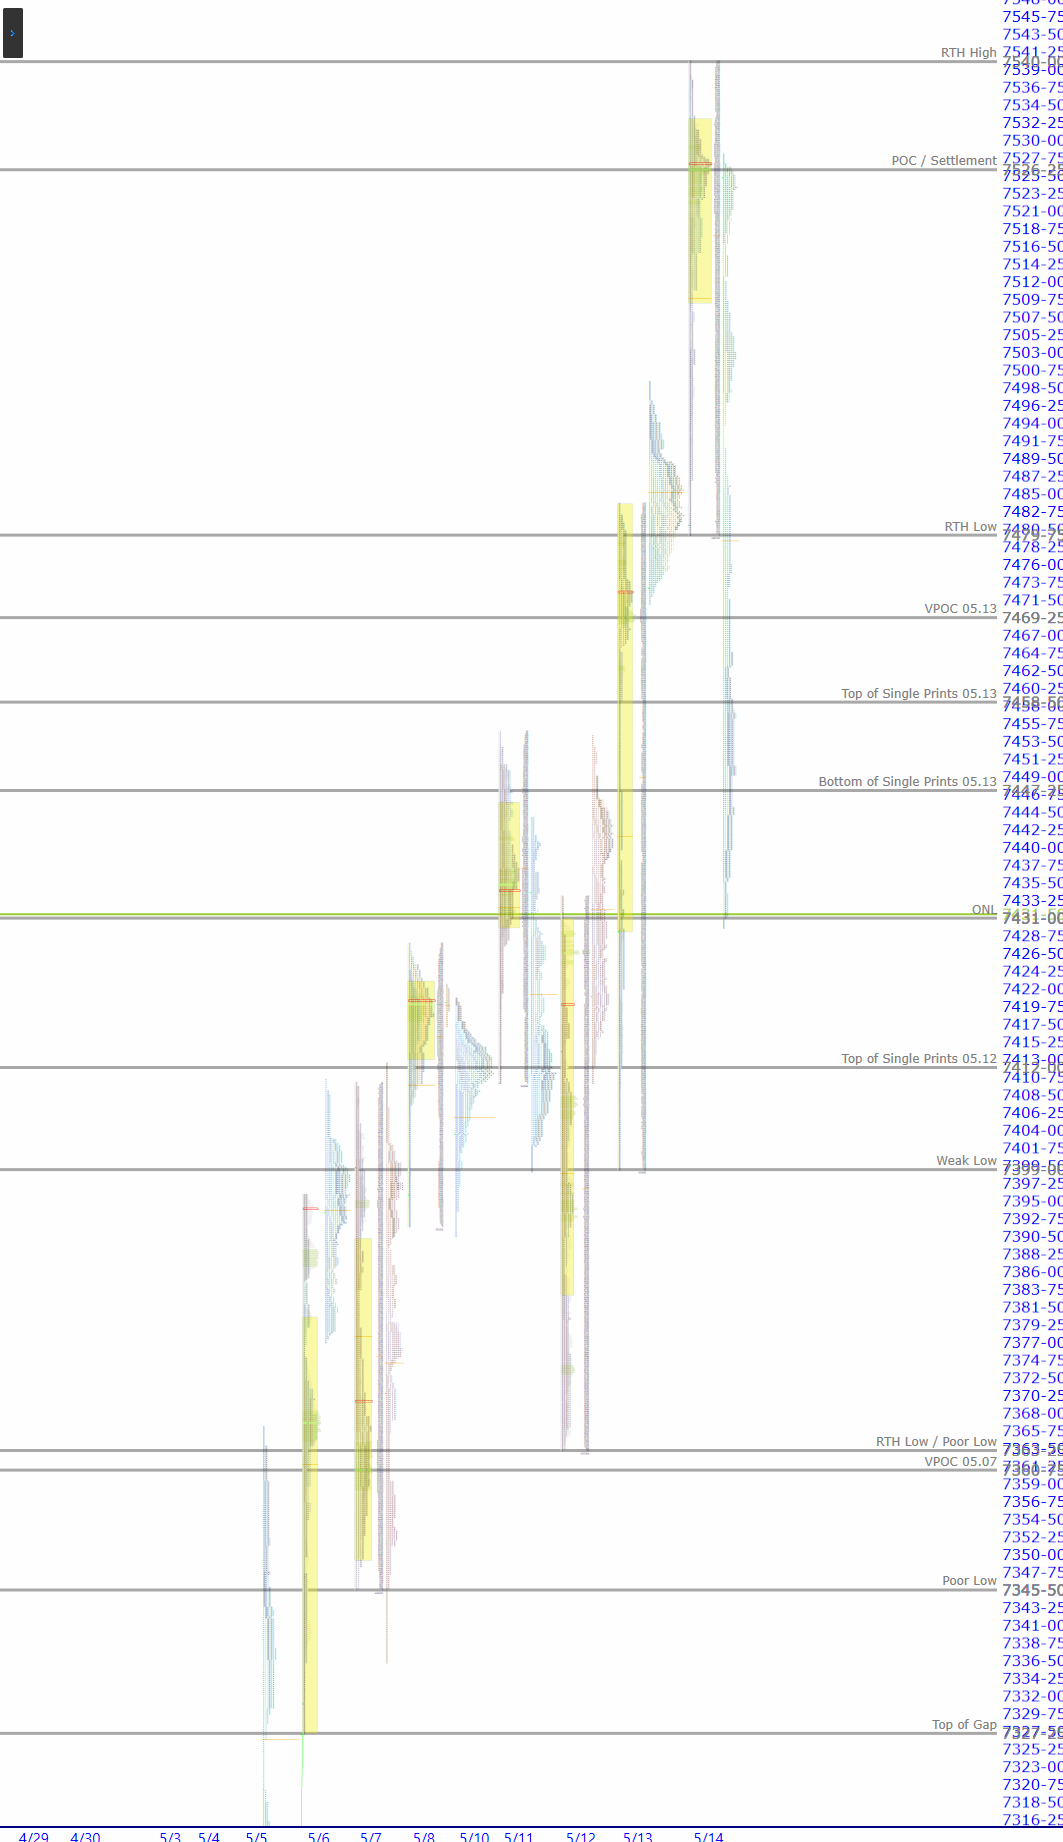
| Today’s Market ProfileA way of reading the market that recognizes either time spent or volume traded at a particular price level. A market profile can be either made up of “TPO’s” (time price opportunities), or volume. TPO’s measure how much time was spent at a particular price, while volume-based market profiles measure how much volume traded at a particular price. Generally, market profile is used in the trading of futures, especially the /ES. ShadowTrader utilizes volume based profiles. Chart |
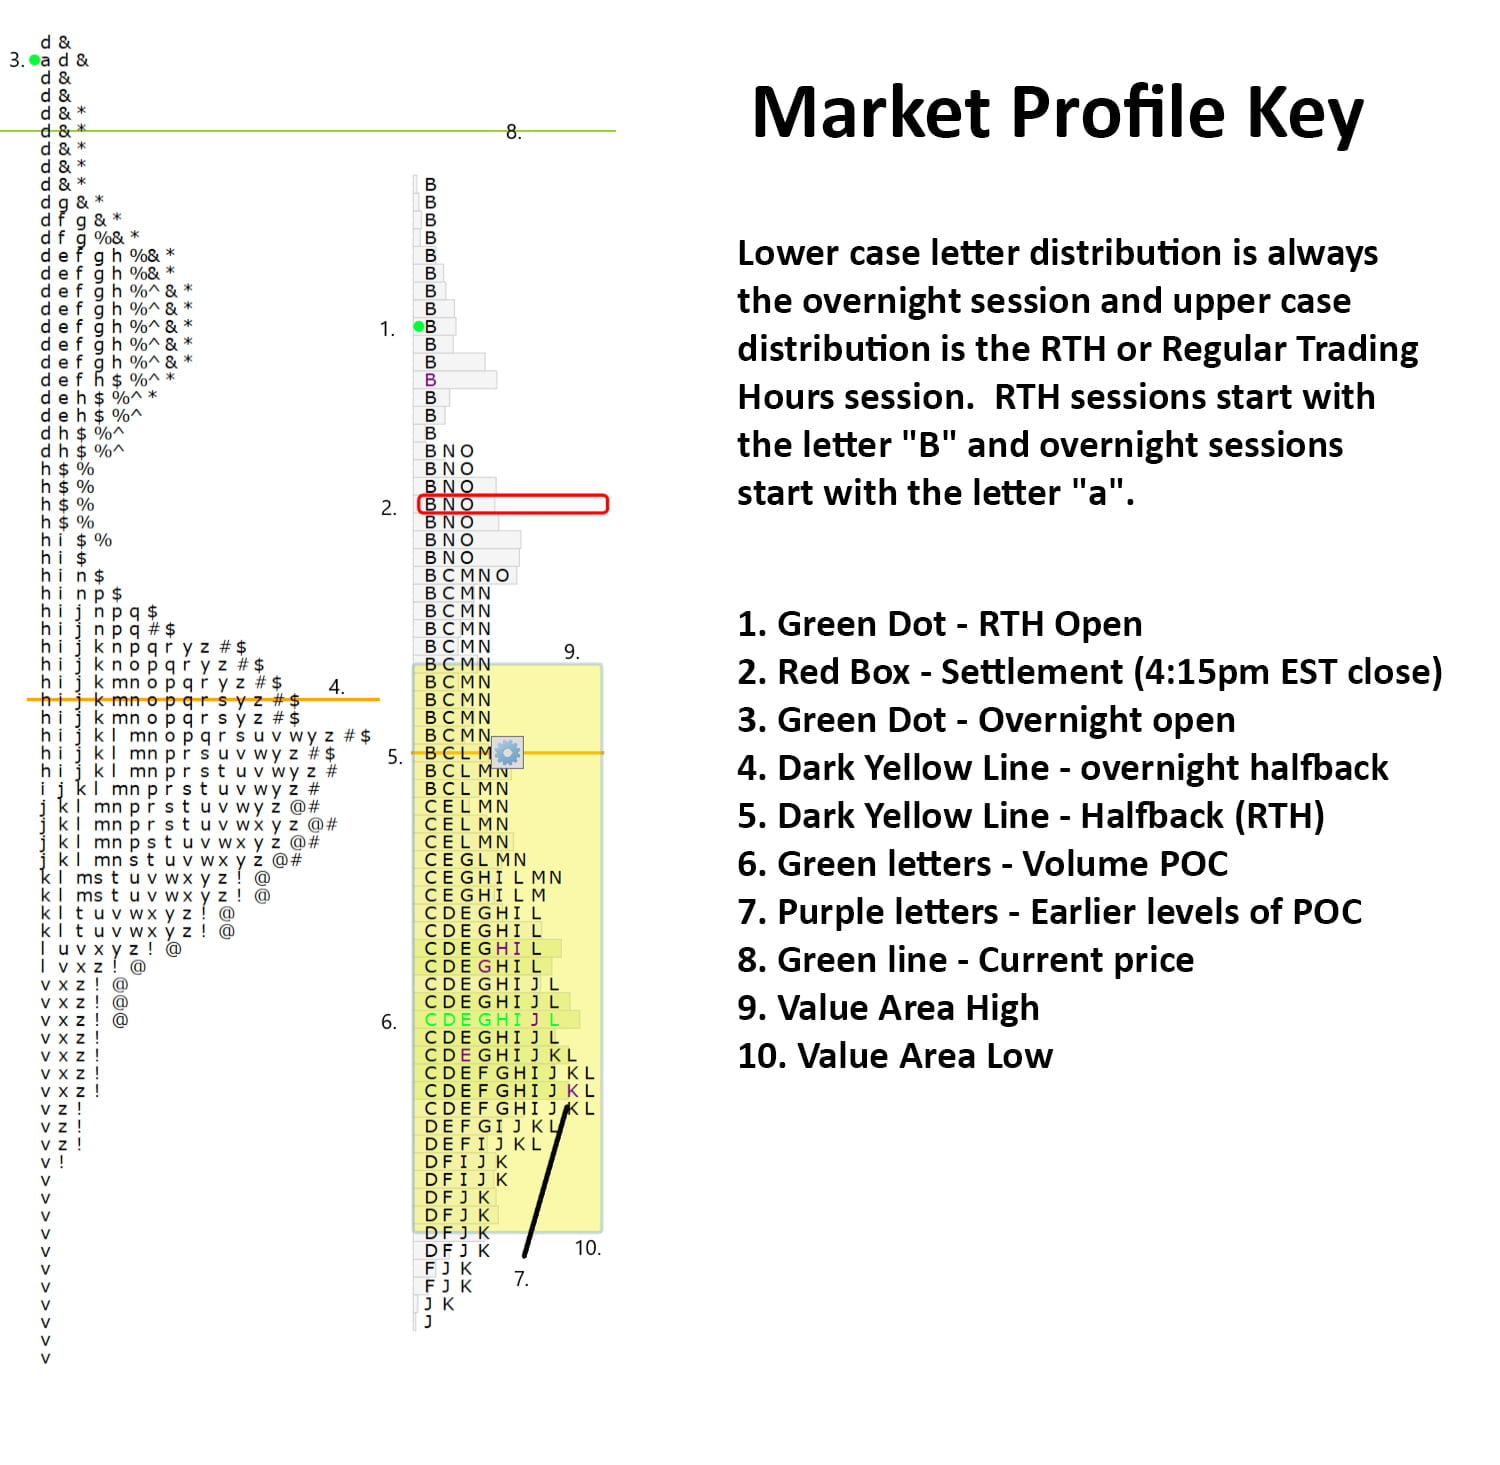
The chart provided is from WindoTrader. CLICK HERE to learn more about the ShadowTrader discount. Interpret the chart above with the Market Profile Key.
| Key Levels for Today | ||
| 7540.00 | RTHRegular Trading Hours. In the /ES this means the price action from 9:30am EST to 4:15pm EST only. High | |
| 7526.25 | POCPoint of Control, also known as the "fairest price to do business". It is the price level in the /ES where the greatest amount of volume in the prior RTH session traded. ShadowTrader measures the POC using volume but the traditional way is to mark off the widest point of the day's distribution where the most TPO's printed going across from left to right, indicating that that was the price where the most time was spent. It's important to pay attention to both the volume POC and the TPO POC. / Settlement | |
| 7479.75 | RTHRegular Trading Hours. In the /ES this means the price action from 9:30am EST to 4:15pm EST only. Low | |
| 7469.25 | VPOCVirgin Point of Control. This is a point of control level that has not yet been tested (traded through) during an RTH session. If the POC gets tested during an overnight session, it does not count and remains "virgin" until it happens during a day session. 05.13 | |
| 7458.50 | Top of Single PrintsAny section of the market profile distribution that is only one TPO wide. Single prints are a sign of emotional buying or selling as very little time was spent at those levels and thus there is no value there. The endpoints of single print sections are considered to be potential support or resistance points. 05.13 | |
| 7447.25 | Bottom of Single PrintsAny section of the market profile distribution that is only one TPO wide. Single prints are a sign of emotional buying or selling as very little time was spent at those levels and thus there is no value there. The endpoints of single print sections are considered to be potential support or resistance points. 05.13 | |
| 7431.00 | ONLOvernight Low. A term mostly used for the futures market as it trades almost around the clock. To be precise, in the /ES this would be the lowest price between 4:30pm EST and 9:30am EST the next day. | |
| Virgin Point of ControlAlso called “POC” for short. The level in the futures inside the value area where either the greatest amount of volume traded in the prior session, or the greatest amount of time was spent as measured by the number of TPO’s going across. Measured this way, the POC would be the widest part of any given market profile. While ShadowTrader calculates its value areas and points of control using volume exclusively, we are always very aware of where the TPO POC is and it’s relation to current prices or patterns in the profile. Both are very important. (VPOCVirgin Point of Control. This is a point of control level that has not yet been tested (traded through) during an RTH session. If the POC gets tested during an overnight session, it does not count and remains "virgin" until it happens during a day session.) | ||
| 7469.25 | 05.13.26 | |
| 7360.75 | 05.07.26 | |
| 7287.00 | 05.05.26 | |
| 7230.00 | 05.04.26 | |
| 7077.75 | 04.16.26 | |
| 7002.25 | 04.14.26 | |
| 6923.25 | 04.13.26 | |
| 6773.50 | 03.17.26 | |
| 6630.00 | 04.07.26 | |
| 6430.00 | 03.30.26 | |
| Today’s ESThe S&P 500 e-mini contract. In the broadcast we use this as our primary instrument to define market direction and effect short term trades when we have a bias in the market. This is the electronic contract that trades around the clock, as opposed to the pit traded contract. Sometimes the pit traded version is called the “big contract”. Futures contracts on are denoted by two letters and then a letter and a number to define their expiration month. The ES has four contract periods per year which expire in March, June, September, and December. These four months are denoted by the letters H, M, U, and Z. For example, if it was 2012, then the March contract would be called the /ESH2. Thinkorswim requires a forward slash before the letters. Certain trading platforms and charting packages ma... and NQThe Nasdaq 100 E-Mini futures. In the broadcast we only discuss this contract in the pre-market to get a feel for where the Nasdaq will open. Market ProfileA way of reading the market that recognizes either time spent or volume traded at a particular price level. A market profile can be either made up of “TPO’s” (time price opportunities), or volume. TPO’s measure how much time was spent at a particular price, while volume-based market profiles measure how much volume traded at a particular price. Generally, market profile is used in the trading of futures, especially the /ES. ShadowTrader utilizes volume based profiles. and Pivot Point Numbers | ||
| Value Area HighThe high end of the range of the value area. | 7532.75 | 29769.00 |
| Point of ControlAlso called “POC” for short. The level in the futures inside the value area where either the greatest amount of volume traded in the prior session, or the greatest amount of time was spent as measured by the number of TPO’s going across. Measured this way, the POC would be the widest part of any given market profile. While ShadowTrader calculates its value areas and points of control using volume exclusively, we are always very aware of where the TPO POC is and it’s relation to current prices or patterns in the profile. Both are very important. | 7526.25 | 29690.00 |
| Value Area LowThe low end of the range of the value area. | 7508.75 | 29637.00 |
| R3 | 7610.50 | 30151.00 |
| R2 | 7575.25 | 29966.50 |
| R1 | 7550.25 | 29827.50 |
| Pivot | 7515.00 | 29643.00 |
| S1 | 7490.00 | 29504.00 |
| S2 | 7454.75 | 29319.50 |
| S3 | 7429.75 | 29180.50 |


